
Applying a Set of Gabor Filter to 2D-Retinal Fundus Image to Detect the Optic Nerve Head (ONH)
2 Laboratory of Research in Biophysics and Medical Technologies LRBTM Higher Institute of Medical Tech, University of Tunis El Manar Address: 9, Rue Docteur Zouheïr Safi – 1006, Tunisia
3 Faculty of Medicine of Tunis, Address: 15 Rue Djebel Lakhdhar. La Rabta. 1007, Tunis, Tunisia
Citation: Belgacem R, et al. Applying a Set of Gabor Filter to 2D- Retinal Fundus Image to Detect the Optic Nerve Head (ONH). Ann Med Health Sci Res. 2018; 8: 48-58
This open-access article is distributed under the terms of the Creative Commons Attribution Non-Commercial License (CC BY-NC) (http://creativecommons.org/licenses/by-nc/4.0/), which permits reuse, distribution and reproduction of the article, provided that the original work is properly cited and the reuse is restricted to noncommercial purposes. For commercial reuse, contact reprints@pulsus.com
Abstract
Background: The detection of edge of the cup (excavation), disc, and the optic nerves head which converges into the center of the excavation in the papilla of the retina is a crucial procedure in computer vision object detection processing and analysis. Purpose: We propose a method and approach for cup and disc detection based on 2-D Gabor filter with the addition of some constraints. This paper approves that edge magnitude and edge phase are useful for extracting the disc and the cup and to overcome the lack contrast between the cup-disc in order to discriminate one from the other and to extract the different optical vessels along several directions theta. These methods are based on space image and phase image after searching the favorable parameters (Scale, sigma, a & b, r ...) to properly adjust the results of the application of kernels Gabor on the fundus image of the retina to calculate the magnitude image and the phase image which each bring additional information on the excavation of the of the optic nerve head ONH to help to early glaucoma disease screening. Results: The proposed method was applied on several retinal images issued from a set of images of Tunisian glaucomatous database. A total of 60 images were used. For an input image, several features were determined, such as edge of the disc, edge of the cup, boundaries of the papilla and calculate magnitude image and phase’s image. Fitting sigma, scale, spatial frequency F0 and (a, b) parameters were adjusted to aggregate the Gaussian kernel function modulated by a sinusoidal plane wave, ωr (x, y) and C (x, y) a complex sinusoid, respectively. The Signal-to-Noise Ratio SNR and the mean square error MSE were used to identify the optimum fitting parameters instigated in the Gabor function and convolved with the retinal image to detect the magnitude and phase image over different orientations for the segmentation of cup and the disc and the optic nerve head ONH. Conclusions: 2D Gabor filters are analyzed and the apply a set of Gabor filter to 2Dfundus image of retina is efficacious to detect the optic nerve head ONH and the Gabor filter banks for texture classification of the papilla and pattern analysis of the cup and the Disc. The results given in this paper can be useful by an ophthalmologist to diagnosis a glaucomatous case. Segmentation of the cup and the disc through the bank Gabor filter proved functional for glaucomatous diagnosis and screening the pathology.
Keywords
Excavation; Glaucoma; Segmentation; Optic Cup (OC) and Optic Disc (OD); Set of Gabor filter; Texture Classification and pattern analysis
Introduction
Glaucoma is a disease that is asymptomatic until advanced stages, in this paper we use Gabor filters for 2D-image analysis have been extensively used as convolution filters, [1,2] motivated by search results in Biological vision systems [3] to detect this disease and screening it until total blindness. The 2D-Gabor filters occupy an irreducible volume in a four-dimensional hyper-space of information whose axes can be interpreted as 2D visual space, Orientation and spatial frequency. [4] Even if the properties of the 2D-Gabor filters (e.g. orientation selectivity and the compromise between spatial and frequency resolutions) correspond to the first psychophysical and physiological results, they were finally confirmed for the modeling of simple receptive fields thanks to a series of 2D experiments on simple cells of human beings [4] and cats. [5-7] However, not all current psychophysical and physiological researchers agree with this model. [8]
2D-Gabor filters were considered an important instrument for a variety of image pattern processing and recognition problems (e.g., image enhancement, [9] Compression, [10] texture analysis, [11] edge and line detection, [12] biometrics Recognition, [13] object detection [14] and segmentation [15]. In order to maximize the performance of the systems in terms of accuracy, researchers used optimization algorithms to adjust the Gabor parameters [16] and to increase the filtering speed; they proposed orientable Gabor type filters, [17] a Gabor wavelet [18] and a Gabor filtering system. [19]
To answer the current research, 2D Gabor filters are analyzed. The results [Figure 1] given in this paper are the segmentation and extraction of patterns:

Figure 1: (a) The real part and the imaginary part of a Gabor filter. (b) The real and imaginary parts of a complex sinusoid. (c) The response of the convolution of the retinal image and the real imaginary parts of a complex Gabor function in space domain (Gabor magnitude response). (d) Gabor phase responses. The images are ‹1000 × 1054 × 3 unit 8 › pixels. The parameters are as follows: x0=y0=0, a=1/50 pixels, b= 1/40 pixels, θ=(-π/8; π/8), F0=√2/80 cycles/pixel, ω0=45 degrees, φ=0 degree.
Papilla, disc, cup and vessel’s detection are along several orientations. A 2D Gabor filter in a spatial domain is defined bellow and the results of the convolution of the Gabor filter bank with the input imaging shows its robustness of segmenting the papilla and separating the cup from the disc thus visualizing the optical nerves (vessels) that converge towards the head of the optic nerve following different orientations theta [20] to distinguish those that blow from necrosis to increase intraocular pression IOP and which is a factor generates glaucoma and its early screening using machine learning can help avoid total blindness before this pathology reaches an advanced stage to reduce glaucoma severity and vision loss.
Segmentation of the optic nerve head
Several recent theoretical models for human spatial vision postulate that cortical receptive fields act to minimize simultaneously the product of the standard deviation of the sensitivities to position (Δx) and to spatial frequency (Δω) [21] in accord with the uncertainty principle from Fourier analysis.
The receptive-field functions resulting from these approach one-dimensional or two-dimensional Gabor elementary functions have been shown by others to fit measured receptive fields adequately in some species. [22] However, only complexvalued Gabor functions minimize this product, and these cannot be fitted to single-cell receptive fields. We point out that the derivations of others have an implied metric or measure of positional and spatial-frequency uncertainties and that there is an infinitely large class of such metrics, many of which yield other receptive-field functions that are quite plausible biophysically. We review neurophysiological measurements of others and analyze psychophysical masking data and find that in many cases receptive-field functions other than Gabor functions fit better. We conclude that there are insufficient theoretical demonstrations and experimental data to favor Gabor functions over any of a number of other plausible receptive-field functions.
A novel peripheral processing method is proposed to segment total field strain distributions from interferometric deformation patterns by use of Gabor filters. This novel strategy is specifically proposed for strain measurement with a Gabor filter used as a set of wavelets. [23] To increase computational speed as well as for selection of contour intervals, judicious design of the filter bank, based on the border pattern and the necessities of the user, is crucial in this methodology. A filter design strategy is developed and, based on the proposed filter design scheme; properly designed filter banks are generated and applied for strain contouring in low-strain and strain concentration regions. This scheme allows one to measure engineering strains within regions of interest and hence provides the design engineer great flexibility of monitoring, testing, or analysis. [24]
Texture segmentation involves subdividing an image into differently textured regions. Many texture segmentation schemes are based on a filter-bank model, where the filters, called Gabor filters, are derived from Gabor elementary functions. The aim is to transform texture differences into detectable filter-output discontinuities at texture boundaries. By locating these discontinuities, one can segment the image into differently textured regions. Distinct discontinuities occur, however, only if the Gabor filter parameters are suitably chosen. Some previous analysis has shown how to design filters for discriminating simple textures. Manipulative filters by the optimum parameters; for more general natural textures, though, has largely been done. We have devised a more rigorously based method for designing Gabor filters by the fitting parameters who controlled the convolution of the kernel Gabor filters with the retinal image to obtain finest texture describe all schemes (vessels, papilla, disc, cup and the optic nerve head ONH) confined in this regions. It assumes that an image contains two different textures and that prototype samples of the textures are given a priori. We claim that Gabor filter outputs can be modeled as Rician random variables [25] and develop a decisiontheoretic algorithm for selecting optimal filter parameters. To improve segmentations for difficult texture pairs, we also propose a multiple-filter segmentation scheme, motivated by the Rician model. [26] Experimental results indicate that our method is superior to previous methods in providing useful Gabor filters for a wide range of texture pairs.
Methods
Gabor filter banks for texture classification
In image processing, a Gabor filter is a linear filter used for texture analysis, which means that it basically analyses whether there is any specific frequency content in the image in specific directions in a localized region around the point or region of analysis. Frequency and orientation representations of Gabor filters are similar to those of the human visual system, [27] and they have been found to be particularly appropriate for texture representation and discrimination. [28-30] In the spatial domain, a 2D Gabor filter is a Gaussian kernel function modulated by a sinusoidal plane wave [Figure 2].

Figure 1: (a) and (b): The real part and the imaginary part of a complex Gabor function in space domain. The images are ‹1000 × 1054 × 3 unit 8 › pixels. The parameters are as follows: x0=y0=0, a=1/50 pixels, b= 1/40 pixels, θ=-π/4, F0=√2/80 cycles/pixel, ω0=45 degrees, φ=0 degree.
In the next paragraph, we will see how to classify textures based on Gabor filter banks. Frequency and orientation representations of the Gabor filter are similar to those of the human visual system.
The images [Figure 3] are filtered using the real and imaginary parts of various different Gabor filter kernels [Figure 4].

Figure 3: The real part and the imaginary part of a complex Gabor function in space domain. The images are ‹1000 × 1054 × 3 units 8 › pixels. Input retinal image of glaucomatous case used to extract the optic cup (OC) and the optic disc (OD) by applying a set of Gabor filter bank to this image. Resize factor is 0.5

Figure 4: The real part and the imaginary part of a complex Gabor function in space domain for different orientations θ. The images are ‹513 × 961 × 3 unit 8 › pixels.
The mean and variance of the filtered images are then used as features for classification, which is based on the least squared error for simplicity.
The Spatial (2-D) Gabor filter
Here is the formula of a complex Gabor function in space domain used to generate the Gabor filter banks over different frequency and orientation representations: [31,32]
g(x,y)= c(x,y).wr (x,y) (1)
where c (x, y) is a complex sinusoid, known as the carrier, and ωr(x,y) is a 2-D Gaussian-shaped function, known as the envelope.
The complex sinusoid carrier
The complex sinusoid is defined as follows,
c(x,y) = exp (j(2π(u0 x + v0y)+φ) ( 2 )
where (u0, v0) and φ define the spatial frequency and the phase of the sinusoid respectively.
We can think of this sinusoid as two separate real functions, conveniently allocated in the real and imaginary part of a complex function [Figure 5].

Figure 5: The real part and the imaginary part of a complex Gabor function in space domain for different orientations θ. The images are ‹513 × 961 × 3 unit 8 › pixels.
The real part and the imaginary part of this sinusoid are
Re (c(x, y)) = cos (2π(u0 x + v0y)+φ) ( 3 )
Im (c(x, y)) = sin (2π(u0 x + v0y)+φ)
The parameters u0 and v0 define the spatial frequency of the sinusoid in Cartesian Coordinates. [33] This spatial frequency can also be expressed in polar coordinates as magnitude F0 and direction ω0:
 (5)
(5)
 (6)
(6)
u0=F0.cosω0 (7)
v0=F0.sinω0 (8)
Using this representation, the complex sinusoid is:
c(x,y) = exp (j(2π F0 (x cos ω0 +y sin ω0)+φ) ( 9 )
The Gaussian envelope
The Gaussian envelope looks as follows:
 (10)
(10)
where (x0, y0) is the peak of the function, ‘’a ‘’ and ‘’b ‘’ are scaling parameters of the Gaussian where the Gaussian gets smaller in the space domain, if ‘’a’’ and ‘’b’’ get larger. [28] The r subscript stands for a rotation operation such that
(x - x0)r = (x - x0) cosθ + (y- y0)r sinθ (11)
(y- y0)r = - (x - x0) sinθ + (y- y0)rr cosθ (12)
This rotation is clockwise, the inverse of the counterclockwise rotation of the ellipse [Figures 6 and 7].

Figure 6: Segmentation results, magnitude image, using the Gabor function convoluted with the input retinal image through different orientations θ.

Figure 7: Segmentation results, image’s phase, using the space of the phase a tan (θ) of the function’s Gabor convoluted with the input retinal image.
The complex Gabor function
The complex Gabor function is defined by the following 9 parameters called degrees of freedom in the 2D filters Gabor:
• S: Scales the magnitude of the Gaussian envelope.
• (a, b): Scale the two axis of the Gaussian envelope and control the form of the Gaussian function.
• θ: Rotation angle of the Gaussian envelope.
• (x0, y0): Location of the peak of the Gaussian envelope and the center of the filter in the spatial domain.
• (u0, v0): Spatial frequencies of the sinusoid carrier in Cartesian coordinates.
It can also be expressed in polar coordinates as (F0, ω0).
• φ: Phase of the sinusoid carrier.
Each complex Gabor consists of two functions in quadrature (out of phase by 90 degrees), conveniently located in the real and imaginary parts of a complex function. [34,35]
Now we have the complex Gabor function in space domain [Figure 4]:
g (x,y) = S exp (-π (a2 (x - x0)r2 + b2 (y- y0)r2). exp (j(2π(u0 x + v0y)+φ) (13)
Or in polar coordinates,
g (x,y) = S exp (-π (a2 (x - x0)r2 + b2 (y- y0)r2). exp (j(2π F0 (x cosω0 +y sin ω0)+φ) (14)
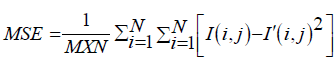
SNR and MSE reprocessed to swell the appropriate parameters involved in the Gabor function to calculate the optimum responses of the magnitudes and phases filter Gabor bank
SNR is a measure independent of the type of noise that we are analyzing, SNR is an important parameter in decide the performance of the applicator of the filter Gabor bank over different parameters but the significance and usability of the parameter is very dependent of the type of noise. SNR is useful in random and uniformly distributed noise (like Gaussian), but in images with other nonlinear noises (like degradation between a threshold or degradation in a specific area and not the whole image) could give bad results.
After processing it with an adaptive median filter h 5 × 5 = 0.04 × I5 × 5 [Figure 8], the final image has a signal to noise ratio since again we can compare it to the Original image in the same way.
As per Figures 8-11, we can:

Figure 8: (a) Original image. (b), (c), (d), (e), (f), (g) and (h) Magnitude image calculated and segmentation results over different spatial frequency F0 to find the fitting F0. (b) F0=0.000177 cycles/pixel, (c) F0=0.00177 cycles/pixel, (d) F0=0.0177 cycles/pixel, (e) F0=0.177 cycles/ pixel, (f) F0=1.77 cycles/pixel, (g) F0=10.77 cycles/pixel and (h) F0=17.7 cycles/pixel.

Figure 9: (a) Original image. (b), (c), (d), (e), (f), (g) and (h) Phase image calculated and segmentation results over different spatial frequency F0 to find the fitting F0. (b) F0=0.000177 cycles/pixel, (c) F0=0.00177 cycles/ pixel, (d) F0=0.0177 cycles/pixel, (e) F0=0.177 cycles/pixel, (f) F0=1.77 cycles/pixel, (g) F0=10.77 cycles/pixel and (h) F0=17.7 cycles/pixel.

Figure 10: (a) Original image. (b), (c), (d), (e), (f), (g) and (h) The real and imaginary parts of a complex Gabor function in space domain for one orientation θ=45° over different spatial frequency F0 to find the fitting F0. (b) F0=0.000177 cycles/pixel, (c) F0=0.00177 cycles/pixel, (d) F0=0.0177 cycles/pixel, (e) F0=0.177 cycles/pixel, (f) F0=1.77 cycles/ pixel, (g) F0=10.77 cycles/pixel and (h) F0=17.7 cycles/pixel.

Figure 11: (a) Original image. (b), (c), (d), (e), (f), (g) and (h) The real and imaginary parts of a complex Gabor function in space domain for one orientation θ=45° and one scale S=20 over different spatial frequency F0. (b) F0=0.000177 cycles/pixel, (c) F0=0.00177 cycles/pixel, (d) F0=0.0177 cycles/pixel, (e) F0=0.177 cycles/pixel, (f) F0=1.77 cycles/ pixel, (g) F0=10.77 cycles/pixel and (h) F0=17.7 cycles/pixel.
• Calculate the Psignal as the mean of pixel values.
• Calculate the Pnoise and the standard deviation or error value of the pixel values.
• Take the ratio or you may use SNR=10 log10 (Psignal/Pnoise) to express the result in decibel.
As per Figures 12-17,

Figure 12: (a), (b), (c), (d), (e), (f), (g) and (h) Magnitude images responses and segmentation results over different scale factor S to fix the fitting S. (a) S=0.005, (b) S=4, (c) S=5, (d) S=10, (e) S=15, (f) S=20, (g) S=25 and (h) S=50.

Figure 13: (a), (b), (c), (d), (e), (f), (g) and (h) Phase images responses and segmentation results over different scale factor S to fix the fitting S. (a) S=0.005, (b) S=4, (c) S=5, (d) S=10, (e) S=15, (f) S=20, (g) S=25 and (h) S=50.

Figure 14: (a), (b), (c), (d), (e), (f), (g) and (h) Real and imaginary parts responses of Gabor function over different scale factor S, F=0.0177 cycles/pixel and θ=π /4. (a) S=0.005, (b) S=4, (c) S=5, (d) S=10, (e) S=15, (f) S=20, (g) S=25 and (h) S=50.

Figure 15: (a), (b), (c), (d), (e), (f), (g) and (h) Real and imaginary parts responses of complex Gabor function over different scale factor S, F=0.0177 cycles/pixel and θ=π /4. (a) S=0.005, (b) S=4, (c) S=5, (d) S=10, (e) S=15, (f) S=20, (g) S=25 and (h) S=50.

Figure 16: (a), (b) and (d) Two representations of Real and imaginary parts responses of Gabor function over different (a, b) factors, S=20, F0=0.0177cycles/pixel and θ=- π /4. (a) (a, b)=(1/20,1/10), (b) (a, b)=(1/50,1/40), (c) (a, b)=(1/100,1/80), (d) (a, b)=(1/150,1/140).

Figure 17: (A). (a), (b) and (d) Magnitude images responses and segmentation results function over different values of parameters (a, b) and a scale factor S=20, F0=0.00177cycles/pixel and θ=- π /4. (B). (a), (b) and (d) Phase images responses and segmentation results function over different values of parameters (a, b) and a scale factor S=20, F0=0.00177cycles/pixel and θ=- π /4. (a) (a, b)=(1/20,1/10), (b) (a, b)=(1/50,1/40), (c) (a, b)=(1/100,1/80), (d) (a, b)=(1/150,1/140).
PSNR = 10. log10(MAXI2/MSE ) (15)
= 20. log10 (MAXI/√MSE) (16)
= 20. log10 (MAXI) – 10. log10 (MSE) (17)
Where MAXI = 255 pixels.
And
We obtain the results recuperated in Tables 1 and 2.
| Magnitude image responses | I rep |
ho =3*3 replicate Ir = Irep* h0 |
h1 = 3*3 Ir = Irep* h1 |
h2 = 5*5 Ir = Irep* h2 |
|
|---|---|---|---|---|---|
| Signal-to-noise ratio | PSNR (dB) | 7.2054 | 7.2543 | 7.2963 | 7.3747 |
| Mean square error | MSE | 111.2420 | 110.6174 | 110.0840 | 109.0950 |
| Phase image responses | I pha |
ho =3*3 replicate Ir = Ipha* ho |
h1 = 3*3 Ir = Ipha* h1 |
h2 = 5*5 Ir = Ipha* h2 |
|
| Signal-to-noise ratio | PSNR (dB) | 8.5368 | 9.7791 | 9.8068 | 10.6025 |
| Mean square error | MSE | 95.43331 | 82.39044 | 82.12810 | 74.64429 |
Table 1: Calculated of PSNR and MSE over magnitude images responses and phase images responses, respectively, to fix the fitting output responses Ir to use far along for estimated the appropriate parameters: Fo, Scale S and (a, b). For each responses: S = 0.05 ; F0 = 0.0177 Cycles/Pixel and Theta = - 45 degree.
| Measure of MSE & PSNR for Magnitude Image responses for Scale S = 20, (a, b) = (1/ 150,1/ 140) and over different values of spatial frequency F0. | ||||
|---|---|---|---|---|
| F0 (cycles/Pixel) | 0 ,00177 | 0.0177 | 0.177 | 1.770 |
| MSE | 110.6930 | 108.7843 | 107.2061 | 100.6729 |
| PSNR (dB) | 7.2484 | 7.3995 | 7.4236 | 7.8308 |
| Measure of MSE & PSNR for Phase Image responses for Scale S = 20, (a, b) = ( 1/ 150,1/ 140) and over different values of spatial frequency F0. | ||||
| F0 (cycles/Pixel) | 0.00177 | 0.0177 | 0.177 | 1.770 |
| MSE | 58.4724 | 66.9133 | 57.7775 | 110.69 |
| PSNR (dB) | 11.5488 | 11.4832 | 11.4135 | 7.2484 |
| Measure of MSE & PSNR for Magnitude Image responses for a Scale S = 20, over different values of parameters (a, b) and a fix spatial frequency F0 = 0.0177 cycles/pixel | ||||
| (a, b) pixels | 1/20, 1/10 | 1/50, 1/40 | 1/100, 1/80 | 1/150, 1/140 |
| MSE | 109.9098 | 110.1823 | 109.7106 | 108.7843 |
| PSNR (dB) | 7.2759 | 7.2886 | 7.3258 | 7.3995 |
| Measure of MSE & PSNR for Phase Image responses for a Scale S = 20, over different values of parameters (a, b) and a fix spatial frequency F0 = 0.0177 cycles/pixel. | ||||
| (a, b) pixels | 1/20, 1/10 | 1/50, 1/40 | 1/100, 1/80 | 1/150, 1/140 |
| MSE | 58.6291 | 59.1174 | 61.6942 | 66.9133 |
| PSNR (dB) | 12.2781 | 11.9870 | 11.9784 | 11.4832 |
| Measure of MSE & PSNR for Magnitude Image responses for different Scale S, parameters (a, b) are fixed at (1/150, 1/140) and a fix spatial frequency F0 = 0.0177 cycles/pixel. Θ = - 45° | ||||
| Scale S | 5 | 10 | 20 | 50 |
| MSE | 109.7515 | 109.6590 | 108.7843 | 110.1909 |
| PSNR (dB) | 7.3226 | 7.3299 | 7.3995 | 7.2789 |
| Measure of MSE & PSNR for Phase Image responses for different Scale S, parameters (a, b) are fixed at (1/150, 1/140) and a fix spatial frequency F0 = 0.0177 cycles/pixel. Θ = - 45° | ||||
| Scale S | 5 | 10 | 20 | 50 |
| MSE | 78.8202 | 75.5873 | 66.9133 | 59.3325 |
| PSNR (dB) | 10.1980 | 10.4934 | 11.4832 | 10.9834 |
Table 2: Estimated the appropriate parameters: F0, Scale S and (a, b) through the optimum values of PSNR and MSE.
If the estimation is too high, noise may not be properly removed and some artifacts generated. For example, a noisy background may lead to the appearance of insignificant objects with certain structure in the restored image. See the following example [Figure 18].

Figure 18: The signal-to-noise ratio increases as the applicator of a filter h (5 × 5) on the original image I0. Increases SNR more pattern is visible in the calculate magnitude image where F0=0.0177cycles/pixel and θ=- π /4.
Accomplishment the variation of the curves to determinate the fitting parameters F0, S and (a, b)
In order to extract the parameters, appropriate for use in the kernel functions of Gabor filters, the values given in Table 2 were plotted the variation curves of PSNR as functions of F0, S, and (a, b) respectively exploited in the magnitude image response and the phase image response [Figures 19-21] and those of variations of MSE as a function of F0, S, and (a, b) [Figures 22 and 23].

Figure 19: Exploit of the variation of PSNR and MSE over different value of parameter ‘a’ to determine the appropriate value.

Figure 20: Exploit of the curve PSNR=f(Scale) to find the fitting value of the scale S used in the magnitude image response; S=20.


Figure 22: Exploit of the curve MSE=f(Scale) to find the fitting value of the scale S used in the magnitude image response; S=20.

Figure 23: Exploit of the curve MSE=f(Scale) to find the fitting value of the scale S where MSE is min and used in the phase image response; S=20.
PSNR = f (F0, S, (a, b)) and MSE = f (F0, S, (a, b)) give the appropriate values of the parameters which decreases the mean square error and increases the signal-to-noise ratio so the two responses of magnitude and phase [Figures 24 and 25] after having integrated these parameters in the kernel functions of the Gabor filters. [36] [Figures 26-29].

Figure 24: (a), (b) and (d) Magnitude images responses over different values of parameters (a, b) and a scale factor S=20, F0=0.0177cycles/ pixel and θ=- π /4. (b) Magnitude images response corresponding to the appropriate parameters (a, b)=(1/50,1/40).

Figure 25: (a), (b) and (d) Phase images responses over different values of parameters (a, b) and a scale factor S=20, F0=0.0177cycles/pixel and θ=- π /4. (b) Phase images response corresponding to the appropriate parameters (a, b)=(1/50,1/40).

Figure 26: (a) and (b) represented the evolution of psnr and mse over different value of ‘’ a ‘’ into kernel image response.

Figure 27: The intersection of the two curves psnr=f(a) and mse=f(a) to get the fitting value of a=1/50.

Figure 28: (a) and (b) represented the evolution of psnr and mse over different value of ‘’a’’ into phase image response.

Figure 29: The intersection of the two curves PSNR=f(a) and mse=f(a) to get the fitting value off a=1/50 into phase image response.
Experimental results
We apply a set of Gabor filter [Figures 30 and 31] to 2D-fundus image of retina [Figure 3].

Figure 30: (a), (b) and (d) Real and imaginary parts responses of a complex Gabor function over different (a, b) factors, S=20, F0=0.0177cycles/pixel and θ=- π /4. (a) (a, b)=(1/20,1/10), (b) (a, b)=(1/50,1/40), (c) (a, b)=(1/100,1/80), (d) (a, b)=(1/150,1/140).

Figure 31: (a), (b) and (d) Real and imaginary parts responses of a complex Gabor function over different (a, b) factors, S=20, F0=0.0177cycles/pixel and θ=- π /4. (a) (a, b)=(1/20,1/10), (b) (a, b)=(1/50,1/40), (c) (a, b)=(1/100,1/80), (d) (a, b)=(1/150,1/140).
for texture segmentation and to detect the optic nerve head (cup-disc) in order to demonstrate its performance to separate the two regions cup and disc since of the insignificant variance in contrast among the two regions located in the papilla and to separate well the nerves of the retina oriented in the same direction and the nerves converges to cup along different orientations and frequency. We start by a total of 8 Gabor filters in each case [Figure 32].

Each filter is regulated to one of the four orientations and to one of the five highest radial frequencies. Two-category segmentation obtained [Figures 33 and 34] using a total of 8 Gabor filters tuned to fitting parameters previously searched and fixed in the equation which represents the kernel of Gabor filter function.

Figure 33: Segmentation obtained into magnitude image response using a total of 8 Gabor filters tuned to fitting parameters previously searched.

Figure 34: Segmentation obtained into magnitude image response using a total of 8 Gabor filters tuned to fitting parameters previously searched.
Results
This paper presents a texture segmentation procedure stimulated by the multichannel filtering model for visual information processing in the rushed stages of human visual system. The canals are considered by a bank of Gabor filters that approximately homogeneously covers the spatial-frequency domain, and a methodical filter range pattern is proposed, which is founded on renovation of the input image from the filtered images. Texture patterns are obtained by exposing each filtered image by a convolution on kernel Gabor function to a non-linear transformation and computing a measure of magnitude [Figure 33] or a phase image [Figure 34] responses in a carrier around each pixel. A mean square error clustering algorithm and a signal-to-noise ratio is then used to integrate the appropriates parameters in the kernel Gabor function for an optimum quantifying of the feature images and produce a segmentation. A simple method to include spatial information in the clustering process is proposed. The Tables 1 and 2 regrouped the diverse results acquired when changing the others degrees of liberty to estimate the appropriate values of parameters used yield in texture categories. [36,37]
Using the imaginary part of the Kernel Gabor function can provide more information on the texture of the retina image as well on the classification of cup and disc and other patterns whether at the level of the phase image or at the level of the magnitude image [Figures 35 and 36].

Figure 35: Segmentation obtained into magnitude image response using a 8 imaginary part of kernel Gabor function tuned to fitting parameters previously searched.

Figure 36: Segmentation obtained into phase image response using a 8 imaginary part of the Kernel Gabor function tuned to fitting parameters previously searched.
Discussion
Gabor filter banks for texture classification of the papilla and pattern analysis of the cup and the disc is automatically interesting because the main spatial-frequency components of dissimilar textures are different. An essential progress of the Gabor filter banks approach to texture analysis is that one can acquire immediate results in the phase space or Cartesian space of gray images in the filtered images as texture features. This simplicity is the direct result of decomposing the original image into several filtered images with different orientations and spatial frequency or different scale. The main issues involved in the Gabor filter banks approach to texture analysis are: - functional classification of the parameters and the number of parameters, - extraction of appropriate texture features from the convoluted images, - the liaison between parameters (dependent vs. independent), and integration of texture features from different parameters to yield segmentation.
Different orientations, frequency and scale filtering parameters that are used in the proposed paper differ in their results to one or more of the above issues i.e. parameters give phase images or magnitudes images with more clarity and information. We use a bank of Gabor filters to describe the papilla and the vessels along different orientations and frequency. We show that the filter set forms an approximate basis for a wavelet transform, with the kernel Gabor function as the wavelet. We propose a systematic filter set selection pattern which is based on direct convolution of the input image with Gabor function along different orientations and spatial frequency F0 to determine the filtered magnitudes images and the filtered phase images. Texture discrimination is associated with differences in the attributes of these splotches in different regions. An adjustment approach is then used where the attributes of the papilla are netted by texture features defined by a measure of magnitude image in a small Gaussian envelope around each pixel in the response image. This process generates a feature image corresponding to magnitude and phase filtered image [Figure 1]. The size of the Gaussian envelope for each response image is determined using the adjusted value of parameters ‘’a=1/50’’ and ‘’b=1/40’’ who controls the long of Gaussian envelope axis elliptic.
Conclusion
We have presented an unsupervised texture image segmentation that is a difficult task in image processing. A unique segmentation approach will certainly never be established to be applied to all classes of images. In this paper we have proposed an unsupervised segmentation approach to be applied in textured image segmentation, pointing to increase the performance of the mark of a set Gabor filters segmentation technique. Starting from a well-known algorithm, Gabor filters bank, we modified its standard use by an important perspective of our present work.
Experimental results on a set of various segmented images show better performance of the proposed method in terms of density of the segmented regions as compared to the others methods of segmentation. Based on experimental results, we have shown the superiority unsupervised segmentation approach called Gabor filters banks. Furthermore, the search of other optimal features to distinguish texture and the use of plunging window with a variable size are required to analyze the retinal image where the papilla is located, where the cup-disc is situated with a lack contrast, hence the necessity of an optimal method to diagnose the excavation of the optic nerve head, vessels and early glaucoma disease screening to help the doctor ophthalmologist through machine learning to detect this disease before its progression and that the patient has total blindness.
Competing Interest
The authors declare that they have no competing interests.
Funding
This work is supported in part by 1 Laboratory of Research in Biophysics and Medical Technologies LRBTM Higher Institute of Medical Technologies of Tunis ISTMT; University of Tunis El Manar Address: 9, Rue Dr Zouheïr Safi _1006.
And in additional part by 2 Higher National School of engineering of Tunis, ENSIT, Laboratory LATICE (Information Technology and Communication and Electrical Engineering LR11ESO4), University of Tunis EL Manar. Adress: ENSIT 5, Avenue Taha Hussein, B. P. : 56, Bab Menara, 1008 Tunis.
Acknowledgements
I wish to thank my framer I.J for his constant encouragement throughout this work either by making me understand the different numerical approaches that I have to use either the relevant remarks to refine and adjust our work; I would also like to thank my co-supervisor H.T for the considerable follow-up that prompted me to do my best and for the help he offered me to obtain several grants to participate in the different scholarships and conferences; I thank Professor I. M for his help in explaining the pathology of glaucoma and what fitting features should be used for the early detection of glaucoma.
Author Contribution
I.J., I.M. and R.B conceived and designed the experiments; I.J. and R.B. performed the experiments; I.M., R.B and I.J. analyzed the data; H.T., I.J. and R.B contributed reagents/materials/ analysis tools; R.B. wrote the paper; H.T., R.B., I.M and I.J. discussed and proof-read the manuscript.
Ethics Approval and Consent to Participate
Written informed consent was obtained from the patients for publication of this manuscript and any accompanying images.
REFERENCES
- Gabor D. Theory of communication. Journal of Institution of Electrical Engineers, 1946; 93: 429-457.
- Ibrahim A, Azimi-Sadjadi MR. A fast learning algorithm for Gabor transform. IEEE TIP. 1986; 5: 171-175.
- Daugman JG. Spatial visual channels in the Fourier plane. Vision Research. 1984; 24: 891-910.
- Daugman JG. Uncertainty relation for resolution in space, spatial frequency, and orientation optimized by two-dimensional visual cortical filters. Journal of Optical America A. 1985; 2: 1160-1169.
- Webster MA, De Valois RL. Relationship between Spatial-Frequency and Orientation Tuning of Striate-Cortex Cells. Journal of Optical Society America A. 1985; 2: 1124-1132.
- Jones JP, Stepnoski A, Palmer LA. The two-dimensional spectral structure of simple receptive fields in cat striate cortex. Journal of Neurophysiology. 1987; 58: 1212-1232.
- Daugman JG. Spatial visual channels in the Fourier plane. Vision Research. 1987; 24: 891-910.
- Jones JP, Palmer LA. An evaluation of the two-dimensional gabor filter model of simple receptive fields in cat striate cortex. Journal of Neurophysiology. 1987; 58: 1233-1258.
- De Angelis GC, Ghose GM, Ohzawa L. Freeman R.D.: Functional micro-organization of primary visual cortex: Receptive field analysis of nearby neurons. The Journal of Neuroscience. 1999; 19: 4046-4064.
- Lindenbaum M, Fischer M, Bruckstein A. On Gabor’s contribution to image enhancement. Pattern Recognition. 1994; 27: 1-8.
- Daugman JG. Complete discrete 2-D Gabor transforms by neural networks for image analysis and compression. IEEE Transactions on Acoustics, Speech and Signal Processing. 1988; 36: 1169-1179.
- Bovik AC, Clark M, Geisler WS. Multichannel texture analysis using localized spatial Filters. IEEE TPAMI. 1990; 12: 55-73.
- Mehrotra R, Namuduri KR, Ranganathan N. Gabor filter-based edge detection. Pattern Recognition. 1992; 25: 1479-1494.
- Kong AWK, Zhang D, Kamel M. Analysis of Brute-force break-ins of a palmprint authentication system. IEEE TSMC B. 2006; 36: 1201-1205.
- Young IT, Van Vliet LJ, Van Ginkel M. Recursive Gabor Filtering. IEEE Transactions on Signal Processing. 2002; 50: 2798-2805.
- De Angelis GC, Ghose GM, Ohzawa L, Freeman RD. Functional micro-organization of primary visual cortex: Receptive field analysis of nearby neurons. The Journal of Neuroscience. 1999; 19: 4046-4064.
- Weber DM, Casasent DP. Quadratic Gabor filters for object detection. IEEE TIP. 2001; 10: 218-230.
- Okajima K. Two-dimensional gabor-type receptive field as derived by mutual information maximization. Neural Networks. 1998; 11: 441-447.
- Lindenbaum M, Fischer M, Bruckstein A. On Gabor’s contribution to image enhancement. Pattern Recognition. 1994; 27: 1-8.
- Soares JVB, Learndro JJG, Cesar RM, Jr Jelinek HF, Cree MJ. Retinal vessel segmentation using the 2-D Gabor wavelet and supervised classification. IEEE Transactions on Medical Imaging. 2006; 25: 1214-1222.
- Sun Z, Bebis G, Miller R. On-road vehicle detection using evolutionary Gabor filter optimization. IEEE Transactions on Intelligent Transportation Systems. 2005; 6: 125-137.
- Kalliomaki I, Lampinen J. On steer ability of Gabor-type filters for feature extraction. Pattern Recognition Letters. 2007; 28: 904-911.
- choi wp, tse sh, wong kw, lam km. simplified gabor wavelets for Human Face Recognition. Pattern Recognition. 2008; 41: 1186-1199.
- Marcelja S. Mathematical description of the responses of simple cortical cells". Journal of the Optical Society of America. 1980; 70: 1297-1300.
- Daugman JG. Uncertainty relation for resolution in space, spatial frequency, and orientation optimized by two-dimensional visual cortical filters. Journal of the Optical Society of America A, 1985; 2: 1160-1169.
- Fogel I, Sagi D. Gabor filters as texture discriminator. Biological Cybernetics. 1989; 61.
- Henriksen JJ. 3D surface tracking and approximation using Gabor filters, South Denmark University, March 28, 2007
- Daugman JG. Two-dimensional spectral analysis of cortical receptive field profiles. Vision Res, 1980; 20: 847-856.
- Jones JP, Palmer LA. An evaluation of the two-dimensional Gabor filter model of simple receptive fields in cat striate cortex". J. Neurophysiol. 1987; 58: 1233-1258.
- Haghighat M, Zonouz S, Abdel-Mottaleb M. Identification using encrypted biometrics. Computer analysis of images and patterns. Lecture Notes in Computer Science. 8048. 2013; 440.
- Ramakrishnan AG, Kumar SR, Raghu Ram HV. Neural network-based segmentation of textures using Gabor features, Proc. 12th IEEE Workshop on Neural Networks for Signal Processing, 2002; 365-374.
- Pati PB, Ramakrishnan AG. Word level multi-script identification. Pattern Recognition Letters, 2008; 29: 1218-1229,
- Sabari Raju S, Pati PB, Ramakrishnan AG. Gabor filter based block energy analysis for text extraction from digital document images, Proc. First International Workshop on Document Image Analysis for Libraries (DIAL-04), Palo Alto, USA, 2004; 233-243.
- Nourbakhsh F, Pati PB, Ramakrishnan AG. Text localization and extraction from complex gray images. Proc. Indian Conf. Vision, Graphics Image Processing, ICVGIP 2006, 2006; 776-785.
- Sabari Raju S, Pati PB, Ramakrishnan AG. Text localization and extraction from complex color images, Proc. First International Conference on Advances in Visual Computing (ISVC05), Nevada, USA, LNCS 3804, Springer Verlag, 2005; 486-493.
- Lyons M, Akamatsu S, Kamachi M, Gyoba J. Coding facial expressions with gabor wavelets. Proc. Third IEEE Conference on Automatic Face and Gesture Recognition (FG'98), Nara, Japan, 1998; 200-205.
- Gdyczynski CM, Manbachi A, Hashemi S, Lashkari B, Cobbold RS. On estimating the directionality distribution in pedicle trabecular bone from micro-CT images. Physiological measurement. 2014; 35: 2415.


 The Annals of Medical and Health Sciences Research is a monthly multidisciplinary medical journal.