Classifying Lung and Breast Tumor Prediction Using Support Vector Machine and Deep Convolutional Neural Network
Received: 15-Nov-2023, Manuscript No. AMHSR-23-120248; Editor assigned: 17-Nov-2023, Pre QC No. AMHSR-23-120248 (PQ); Reviewed: 03-Dec-2023 QC No. AMHSR-23-120248; Revised: 02-Jan-2025, Manuscript No. AMHSR-23-120248 (R); Published: 09-Jan-2025
Citation: Aswitha S, et al. Classifying Lung and Breast Tumor Prediction Using Support Vector Machine and Deep Convolutional Neural Network. Ann Med Health Sci Res. 2025;15:1-8
This open-access article is distributed under the terms of the Creative Commons Attribution Non-Commercial License (CC BY-NC) (http://creativecommons.org/licenses/by-nc/4.0/), which permits reuse, distribution and reproduction of the article, provided that the original work is properly cited and the reuse is restricted to noncommercial purposes. For commercial reuse, contact reprints@pulsus.com
Abstract
Cancer remains a global health challenge, demanding innovative solutions for early detection and precise classification. This project presents a multistage approach for tumor classification and detection in the context of classifying between benign and malignant cancer. Our use case is to take breast and lung cancer for deploying our model to predict whether they have benign or malignant tumor. The system leverages SVM machine learning and CNN deep learning technique to provide accurate and actionable insights for medical practitioners. The first stage focuses on breast tumor classification using Support Vector Machines (SVM) based on key tumor biomarkers, including 'mean radius,' 'mean texture,' 'mean perimeter,' 'mean area,' and 'mean smoothness.' This initial classification helps identify malignant cases, prompting further evaluation. In the second stage, Convolutional Neural Networks (CNN) with YOLO (You Only Look Once) are employed for the real-time detection of lung tumors. This stage is triggered when a malignant breast tumor is detected, enabling prompt lung cancer assessment. The final stage addresses the subtyping of malignant lung tumors, categorizing them as adenocarcinoma, large cell carcinoma, or squamous cell carcinoma. This comprehensive approach aids in providing tailored treatment recommendations, enhancing patient care. The project underscores the significance of accurate tumor classification and early detection, which are pivotal in improving patient outcomes and streamlining clinical decision-making.
Keywords
Convolutional Neural Networks (CNN); Mean perimeter; Streamlining; Tumor; Carcinoma
Introduction
Understanding the distinction between benign and malignant cancer is essential for medical professionals to make accurate diagnoses and determine the appropriate course of treatment for patients. So in order for the accurate assessment of the tumor cell we propose a hybrid fusion model where we have developed three different algorithms to classify and predict tumor. We have taken breast and lung cancer for classification of the cancer. The first stage focuses on breast tumor classification using Support Vector Machines (SVM) based on key tumor biomarkers, including 'radius,' 'texture,' ‘perimeter,' 'area,' and 'smoothness.' This initial classification helps identify malignant cases, prompting further evaluation. In the second stage, Convolutional Neural Networks (CNN) with YOLO (You Only Look Once) are employed for the real-time detection of lung tumors.
Cancer, often referred to as the "Emperor of All Maladies," is a complex and pervasive group of diseases that have plagued humanity for centuries. It represents uncontrolled cell growth and proliferation, where the body's natural mechanisms for regulating cell division and death break down. This unregulated growth can lead to the formation of tumors, which can be benign or malignant. Benign tumors are noncancerous growths that typically do not pose a significant threat to health. Benign tumors tend to grow in a contained and localized manner. They do not invade nearby organs of the body. While non-cancerous tumors are not cancerous, they can still cause health issues depending on their size and location. Malignant tumors, in contrast, are cancerous. Malignant tumors have the ability to invade nearby tissues and structures. This invasive behavior is one of the hallmarks of cancer. The cells in malignant tumors often look abnormal, with altered shapes and functions. They do not perform normal cellular functions.
Literature Review
Breast cancer detection using machine learning algorithms, Shubham Sharma. Breast cancer is the most common malignancy among Indian women. Given that one in two Indian women receiving a breast cancer diagnosis pass away, there is a fifty percent risk that a case will be deadly [1]. The purpose of this work is to compare random forest, kNN (k-Nearest-Neighbor), and Naïve Bayes—three widely used machine learning algorithms and methodologies for breast cancer prediction. The performance of the various machine learning algorithms was compared using the Wisconsin diagnosis breast cancer data set as a training set, taking into account important metrics like accuracy and precision. The outcomes are highly competitive and useful for both diagnosis and therapy [2].
Breast cancer detection using machine learning way, Sri Hari Nallamala. According to the breast cancer organization, there is just one type of virus that poses the greatest risk to women in the biosphere, which is breast cancer. Through the use of experimental professionals, identifying this cancer in its early stages facilitates breathing. Personalized funnels for an additional 120 types of cancer were created based on a proposal by cancer.net and were linked to hereditary illnesses. Goaled AI practices have a fundamental role in the diagnosis of breast cancer. We have predicted an adaptive ensemble voting technique that breaks down the Wisconsin Breast Cancer (WBC) record for breast cancer. Our goal is to identify and explain how CNN and the logistic algorithm can be utilized to detect breast cancer while condensing the variables. There are still two types of tumors here [3].
A comparative analysis of breast cancer detection and diagnosis using data visualization and machine learning applications, Muhammet Fatih. One of the main issues facing humanity in the developing countries is cancer mortality. Certain types of cancer still have no known cure, despite the fact that there are numerous ways to stop it before it happens. Breast cancer is one of the most prevalent types of cancer, and the key to treating it effectively is early diagnosis. One of the most crucial steps in the treatment of breast cancer is an accurate diagnosis. Numerous studies on the subject of breast tumor type prediction can be found in the literature. Information regarding breast cancer tumors from Dr. William.
Detecting the location of lung cancer on thoracoscopic images using deep convolutional neural networks, Yuya Ishikawa. The necessity for thoracoscopic pictures to be used for tumor diagnosis during lung cancer surgery has increased due to the increasing popularity of minimally invasive surgeries. In this work, we used thoracoscopic pictures of pulmonary surfaces to assess the tumor detection performance of a Deep Convolutional Neural Network (DCNN). Values of 91.9%, 90.5%, and 91.1% for precision, recall, and F1-measured data, respectively [4].
H. Walberg of the University of Wisconsin hospital was used for making predictions on breast tumor types. The dataset underwent an analysis using several data visualization and machine learning approaches, such as logistic regression, k-nearest neighbors, support vector machine, naïve Bayes, decision tree, random forest, and rotation forest. These machine learning methods and their visualization were to be implemented using R, Minitab, and Python. The article sought to provide a comparative analysis for the diagnosis and identification of breast cancer utilizing machine learning and data visualization tools. The diagnostic capabilities of the programs were similar in terms of identifying breast cancer. In the process of making decisions, data visualization and machine learning approaches can have a major positive influence on cancer diagnosis. Several machine learning and data mining methods for the identification of breast cancer were suggested in this research. The logistic regression model's results, which contained all characteristics, revealed the highest accuracy 98.1.
Existing System
In the existing healthcare system in India, the diagnosis and management of classifying lung cancer and benign cancer as benign and malignant cancer primarily rely on conventional methods and manual interpretation of medical data. Biomarkers and medical imaging, such as CT scans and ultrasound, are examined by healthcare professionals to identify and classify whether they are malignant and benign tumor. However, this process is time consuming and can be prone to human error. The lack of automated and real-time diagnostic tools hinders early detection and efficient management of classifying whether they are malignant or benign tumor [5].
Proposed System
The proposed system is a comprehensive approach to cancer classification and detection, primarily focusing on breast and lung cancer. It consists of three key components: the breast tumor classification model, the lung tumor classification model, and the lung tumor type model.
Breast cancer classification model: This model is designed for the early classification of the breast cancer as cancerous and not cancerous tumor based on a comprehensive set of 30 biomarkers. It employs a support vector regression (SVM) model to analyze and classify biomarker data, achieving an accuracy of 96%. This model can predict whether the tumor is cancerous or not cancerous. If it is cancerous, then it may affect the lung area, so we move to detect if the tumor has spread to other organs [6-9].
Lung cancer classification model YOLOv8: The YOLOv8 model is a real-time object detection system tailored for medical imaging. It can identify and precisely classify whether it is malignant or benign lung cancer in CT scans. It offers a, facilitating quick and informed decisions by healthcare professionals. It predicts in three classes whether it is benign, malignant or normal case if the case is malignant we move to the third case.
Lung cancer type model YOLOv8: The YOLOv8 model proposes to classify the types of malignant lung cancer if the second case predicts the lung cancer as malignant. It can classify the malignant lung cancer into three classes adenocarcinoma, large cell carcinoma, or squamous cell carcinoma [10].
Methodology
Our approach to addressing the challenges of classifying lung and benign tumor as benign and malignant tumor involves a combination of advanced medical imaging analysis and computer vision techniques. The primary goal is early detection, efficient diagnosis, and precise classification as benign and malignant lung and breast tumor. To achieve this, we employ a synergistic model composed of three key components: The breast tumor classification model, lung tumor classification model YOLOv8 and lung type classification YOLOv8.
The breast cancer classification model is a specialized Supervised machine learning (SVM) algorithm designed to analyse specific biomarkers related to classifying benign and malignant in breast tumor using medical images. It operates on a wide range of such as 'mean radius', 'mean texture', 'mean perimeter', 'mean area', 'mean smoothness with a focus on identifying and classifying biomarker abnormalities. Biomarker is an integral part of our methodology, serving as the initial screening tool for classifying the breast tumor. applications.
System architecture
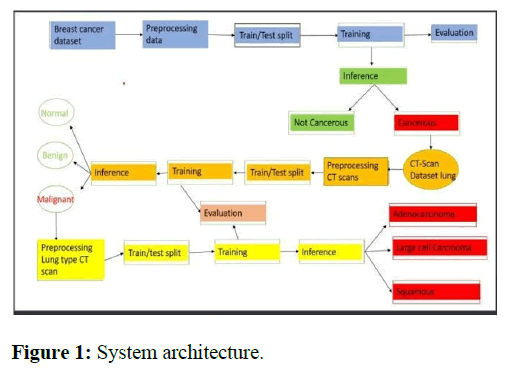
This Figure 1 shows the work flow of the modules and methodology of our proposed system.
Explanation of the system architecture diagram
- Figure 2 provides a visual representation of the workflow followed in our project. The process starts with the collection of breast cancer dataset and preprocessing the data and training the model.
- Firstly, when we give the input for the breast tumor such as mean radius mean smoothness and other 30 features. Using the SVM model we can classify it between both if they are cancerous we proceed to the next step to train the image classification model.
- Next, we develop a classification model for lung cancer whether they are malignant benign or normal tumor and if the case is malignant tumor using the third algorithm we classify whether they are adenocarcinoma, large cell carcinoma, squamous.
- We develop and train the individual model for the lung cancer classification and lung type classification.
The Bio-Marker and YOLOv8 models undergo rigorous training and validation processes using this extensive dataset. The models then learn from these labelled datasets, honing their ability to classify lung and breast tumor as benign and malignant with an excellent accuracy.
In practice, our integrated system operates as a seamless workflow. Bio-Marker processes data such as the features of the breast tumor such as 'mean radius', 'mean texture', 'mean perimeter', 'mean area', 'mean smoothness, with a primary focus on identifying classifying based on the biomarker anomalies, and when potential anomalies are detected, YOLOv8 is employed to further analyse and pinpoint these anomalies for the lung cancer. And if the second model predicts as malignant then we use the third algorithm to classify which type of cancer is the lung cancer. The output of this workflow is a comprehensive report that aids healthcare professionals in making informed decisions regarding patient diagnosis and treatment.
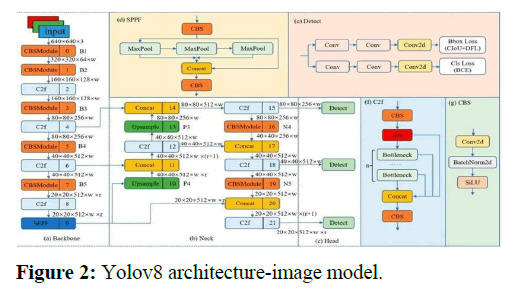
In conclusion, our methodology leverages advanced machine learning and computer vision techniques, and it is supported by robust architectural frameworks: Bio-Marker and YOLOv8. These models work in tandem to enable early detection, precise classification, and efficient management of lung and breast cancer, ultimately contributing to addressing the challenge to classify the breast and lung cancer as benign and malignant cancer health challenges in India and minimizing the adverse effects of these tumor diseases in the country (Figure 2).
YOLOv8 uses the following components
Backbone: The backbone serves as the foundational structure for the YOLOv8 model, and it's a modified version of CSPDarknet53. It provides a robust feature extraction framework, enhancing the model's ability to identify and classify objects within images.
CSP Bottleneck with 2 convolutions and Feature Fusion (C2f): The C2f module plays a crucial role in improving gradient flow throughout the network. It integrates two parallel branches, enhancing information exchange between layers, which is important for maintaining the model's execution and accuracy.
Spatial Pyramid Pooling Fusion (SPPF): The SPPF module withholds spatially segmenting the input data into various regions and pooling features from each segment independently. This enables the model to recognize objects of different scales and sizes within the images.
The execution of the YOLOv8xs model is determined using various parameters like precision, recall, F1-score and prediction time. The various parameters are expressed in equation 1, 2 and 3.
Precision=True positive true positive+False positive......1
Recall =True positive true positive+False negative.......2
F1-Score=2.Precision.Recall precision+Recall.....3
Image model architecture
Convolution Neural Network (CNN) was designed for the classification scale and distribution
Input layer (Conv1d):
- Input channels: 1 (assuming grayscale images)
- Number of filters: 32
- Kernel size: (3,)
- Stride: (1,)
Hidden layer 1 (Conv1d):
- Input channels: 32 (from the previous layer)
- Number of filters: 64
- Kernel size: (3,)
- Stride: (1,)
Fully connected layer 1 (Linear):
- Input features: 1280
- Output features: 128
- Bias terms: Yes
Fully connected layer 2 (Linear):
- Input features: 128
- Output features: 2
- Bias terms: Yes
Support vector machine architecture
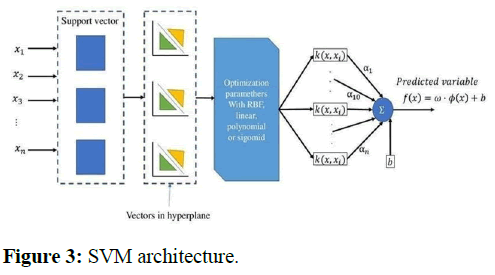
Support Vector Machines (SVMs) are supervised machine learnin g models for classification and regression. They aim to form a hyperplane that maximizes the margin between different classes of data points and find the common point in the hyperplane. SVMs use a kernel trick to handle non-linear data and include a regularization parameter (C) for tuning the balance between margin width and misclassification. The classification is done based on the decision function (Figure 3).
Finding the hyperplane that best divides the data points belonging to distinct classes is the primary goal of SVM. The greatest margin-that is, the separation between the hyperplane and the closest data points from each class-should be present on this hyperplane. The division in the class separation is shown by this margin.
Hyperplane: In a 2-D feature space, a hyperplane is a straight line. In dimensional spaces, it becomes a hyperplane. The equation of a hyperplane is:
w^T × χ + b = 0
Where:
w is a weight vector perpendicular to the hyperplane.
x is the feature vector.
b is a bias term.
Margin: The margin is the distance between the hyperplane and the closest data points from each class. SVM aims to maximize this margin. The data points closest to the hyperplane are called support vectors, and they play a crucial role in determining the position and orientation of the hyperplane.
Formulating the optimization problem: SVM aims to find the hyperplane that maximizes the margin while ensuring that all data points are correctly classified. This is achieved by solving a constrained optimization problem, typically using techniques like the lagrange multiplier.
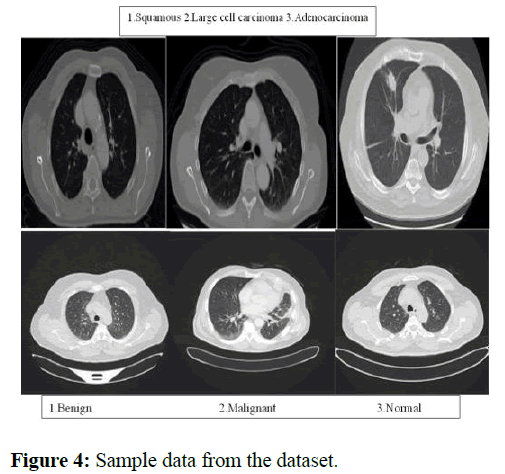
Module description Our system comprises three main modules image model. Data collection and preprocessing (Figure 4).
Lung cancer detection using 120 cases bengin cases 561 cases of malignant and 416 cases of normal cases and A large dataset of CT scan images of lung type is collected with 1000 images of lung types and pre-processed and augmented. The dataset is then split into the ratio 7:2:1 for train valid and test.
Training: The YOLOv8 model is trained using pre-learned weights from the KAGGLE dataset. The customized dataset is used in the training and testing stages. The training model is improved by applying the Adam optimization technique. The model has been trained using optimizer Adam for 10,50,100 epochs with a batch size of 64. The model is trained in Google Colab using Python tools from the Deep Learning Toolbox and the jupyter notebook architecture. In the experimental study, Python modules such as Matplotlib, NumPy, Pandas, and OpenCV packages are employed. Because Cuda makes use of the T4 GPU's image training capabilities, it speeds up the training process.
Model evaluation: The efficacy of the YOLOv5s model was assessed by utilizing a range of critical performance indicators, including as average precision, average recall, F1- score, and prediction time, to assess the trained model's performance on the validation set. The performance is evaluated for the models at several epochs (10, 50, and 100) using an IoU threshold of 0.65. Training took place over four distinct epochs (10, 50, 100, and 200). It showed remarkable performance in classifying lung cancer and its kinds at every epoch.
- At Epoch 10, it showed promising results with high precision, recall, and mAP scores.
- By Epoch 50, the model's performance significantly improved, indicating accurate object detection and localization.
- At Epoch 100, it maintained a high level of precision, recall, and mAP scores, with consistent performance across IoU thresholds.
- Epoch 200 showcased remarkable performance with consistently precision, recall, and mAP scores, highlighting the model's accuracy in detecting and localizing objects.
Breast cancer detection model
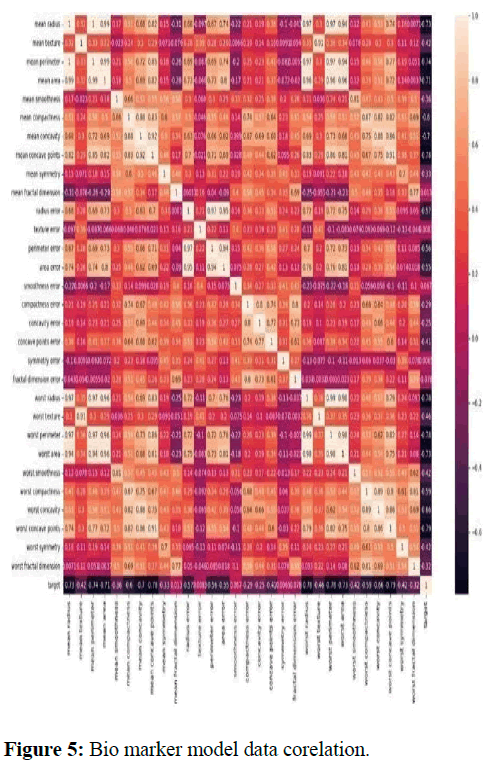
Data collection and preprocessing: A comprehensive set of 30 biomarkers was employed as crucial diagnostic features. These biomarkers included mean radius, mean texture, mean perimeter, mean area, mean smoothness, mean compactness, mean concavity, mean concave points, mean symmetry, mean fractal dimension, radius error, texture error, perimeter error, area error, smoothness error, compactness error, concavity error, concave points error, symmetry error, fractal dimension error, worst radius, worst texture, worst perimeter, worst area, worst smoothness, worst compactness, worst concavity, worst concave points, worst symmetry, worst fractal dimension (Figure 5).
To ensure the quality and reliability of the dataset, over 400 patient samples were collected, comprising with 1200 data. The dataset was subjected to a rigorous data preprocessing stage, which involved addressing null values by imputing them with appropriate statistical measures such as mean and mode samplings.
Furthermore, to enhance the consistency and comparability of the numerical features, normalization was applied. This critical step helped to bring all the features to a common scale and distribution, which is important in the context of machine learning model training.
The final dataset, thus, consisted of meticulously preprocessed biomarker data, carefully balanced between malignant, benign and normal cases. With this dataset, the study was well-equipped to develop and evaluate ML models for the accurate diagnosis of breast cancer tumor based on these diverse and informative biomarkers. The balanced dataset.
Model training: Utilizing the training dataset, train the chosen model. The model will discover the correlation between the input biomarkers and the breast cancer labels during training. To understand the connection between input characteristics and output labels, we create a unique architecture.
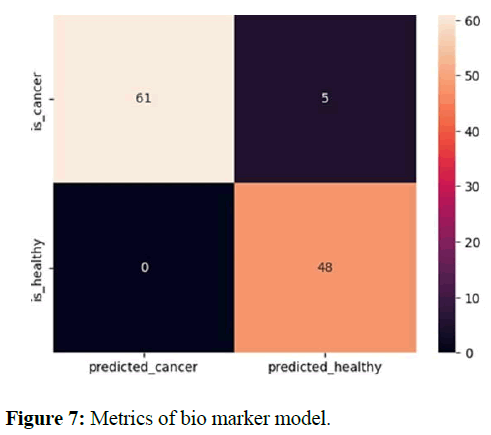
Model evaluation: Metrics including Average Precision, Average Recall, F1-Score, and Prediction Time are used to evaluate the effectiveness of the model. The performance is assessed for the models. The bio-marker model trained on 30 biomarkers demonstrated an outstanding overall accuracy of 96% in classifying the breast cancer as benign and malignant and normal cases.
Results and Discussions
The YOLOv8 model is trained and tested on the CT scan dataset. A sixteen-batch deep learning-based detection model is trained with the AdamW optimizer. AdamW's parameter groups are 66 weight (decay=0.0), 77 weight (decay=0.0005), and 76 bias (decay=0.0). His learning rate is 0.001429 and his momentum is 0.9. Using a transfer learning approach and pre-learned weights from the Kaggle dataset, the YOLOv8 suggested model is developed. The suggested YOLOv8 model is a very precise, lightweight, and time-efficient detector.
In this study, we evaluated the performance of a classification model on a dataset of 270 images (Figure 6). The model was trained for 10, 50, 100 and 200 epochs and achieved the following results:
These results indicate that the model is able to classify both the lung tumor and lung tumor types with high accuracy. The model's performance is also relatively consistent across all classes, with no major differences in accuracy between the classes.
In this study, the model achieved its best performance at 100 epochs. Training the model for longer did not improve the model's performance, and in fact, led to a decrease in performance on the validation dataset. This suggests that the model over fit the training data after 100 epochs. The biomarker model trained on 30 biomarkers demonstrated an outstanding overall accuracy of 96% in classifying whether breast tumor is cancerous or not cancerous. The precision, recall, and F1-scores for both cancerous and non-cancerous cases were also notably high, emphasizing the model's ability to accurately discriminate between cancerous patients and those without cancer. These results are indicative of the potential of ML as a valuable aid for cancer diagnosis. The developed model's remarkable 96% accuracy clearly outperforms conventional diagnostic methods. Moreover, the model exhibits balanced performance in identifying both breast cancer and non-cancerous cases (Table 1 and Figure 7).
| Table 1: Average performance metrics for each training model. | ||||||||
|---|---|---|---|---|---|---|---|---|
| x | Lung | Lung type | ||||||
| Precision | Recall | Accuracy | Training time | Precision | Recall | Accuracy | Training time | |
| 10 | 0.871 | 0.886 | 0.851 | 0.135 | 0.919 | 0.886 | 0.913 | 0.121 |
| 50 | 0.891 | 0.958 | 0.871 | 0.212 | 0.931 | 0.954 | 0.921 | 0.151 |
| 100 | 0.909 | 0.969 | 0.909 | 0.393 | 0.966 | 0.967 | 0.966 | 0.284 |
| 200 | 0.909 | 0.962 | 0.908 | 0.434 | 0.966 | 0.962 | 0.966 | 0.312 |
Table 1: Average performance metrics for each training model.
Overall, the outcome of this study suggest that the model is a well-trained and effective for classification model that can be used to detect both breast cancer and lung cancer were malignant or benign or normal with high accuracy. The model is also likely to be able to generalize well to new data. The study underscores the potential of ML such as SVM as a powerful tool in breast cancer diagnosis, offering superior accuracy and versatility compared to traditional diagnostic methods. This advancement could significantly enhance the early detection and management of breast cancer, ultimately enhancing patient outcomes and reducing the healthcare situations associated with this condition.
Conclusion
In conclusion, this study presents a promising approach to addressing the critical challenges posed by breast cancer and Lung cancer in India. By leveraging advanced machine learning and deep learning techniques, the bio-marker and YOLOv8 models offer valuable tools for the early detection, precise diagnosis, and efficient management of breast and lung cancer related conditions. The bio-marker model demonstrates its ability to accurately predict breast cancer based on bio-marker data with an impressive accuracy of 96.00%. This aids in the timely identification of potential issues with cancer biomarkers, contributing to early intervention and improved patient care. The utilization of deep learning in cancer diagnosis offers several advantages over traditional methods. First, machine learning models can learn intricate patterns from large patient datasets, enabling them to detect complex patterns that might elude human observers. Second, these models can continuously improve their accuracy by updating with new data, ensuring that they remain effective over time. Third, the implementation of machine learning models in computer software makes them easily deployable in clinical settings, offering a practical and efficient approach to breast cancer diagnosis. The YOLOv8 model excels in the real-time classification of lung cancer and lung cancer type in CT scan images, offering a mean average precision of 96.66%. By pinpointing anomalies like benign, malignant, normal for lung cancer and lung cancer type detects three cases adenocarcinomo, large cell carcinoma, squamous cell carcinoma. It provides detailed information to healthcare professionals, facilitating timely decisions on diagnosis and treatment. Both models are supported by an extensive dataset, ensuring relevance to the local population. The use of transfer learning expedites training, making the models efficient and lightweight. This approach enables swift and informed decision-making, which is crucial in healthcare scenarios.
Overall, these models, along with a user-friendly interface for biomarker data entry and image analysis, offer a comprehensive solution for the timely diagnosis and management of lung diseases in India. The results and methodology presented in this study indicate the potential for significant improvements in patient care, addressing the farreaching health and economic impacts of cancer diseases.
References
- Sharma S, Aggarwal A, Choudhury T. Breast cancer detection using machine learning algorithms. In2018 International conference on computational techniques, electronics and mechanical systems (CTEMS). IEEE. 2018:114-118.
- Nallamala SH, Mishra P, Koneru SV. Breast cancer detection using machine learning way. Int J Recent Technol Eng. 2019;8:1402-1405.
- Asuntha A, Srinivasan A. Deep learning for lung Cancer detection and classification. Multimed Tools Appl. 2020;79.
- Mammeri S, Amroune M, Haouam MY, Bendib I, Corrêa Silva A. Early detection and diagnosis of lung cancer using YOLO v7, and transfer learning. Multimed Tools Appl. 2024;83:30965-30980.
- Ji Z, Zhao J, Liu J, Zeng X, Zhang H, et al. ELCT-YOLO: An efficient one-stage model for automatic lung tumor detection based on CT images. Mathematics. 2023;11(10):2344.
- Ishikawa Y, Sugino T, Okubo K, Nakajima Y. Detecting the location of lung cancer on thoracoscopic images using deep convolutional neural networks. Surg Today. 2023;53:1380-1387.
[Crossref] [Google Scholar] [PubMed]
- Arbour KC, Riely GJ. Systemic therapy for locally advanced and metastatic non–small cell lung cancer: A review. JAMA. 2019;322:764-774.
[Crossref] [Google Scholar] [PubMed]
- Miller M, Hanna N. Advances in systemic therapy for non-small cell lung cancer. BMJ. 2021;375.
[Crossref] [Google Scholar] [PubMed]
- Postmus PE, Kerr KM, Oudkerk M, Senan S, Waller DA, et al. Earland locally advanced non-small-cell lung cancer (NSCLC): ESMO clinical practice guidelines for diagnosis, treatment and follow-up. Ann Oncol. 2017;28:1–21.
- Elnakib A, Amer HM, Abou-Chadi FE. Early lung cancer detection using deep learning optimization. Int J Online Biomed Engin. 2020;16:82-94.




 The Annals of Medical and Health Sciences Research is a monthly multidisciplinary medical journal.