
Current Focus on Utilization of UV-Visible Spectroscopy in Multiple Pharma Research
Received: 15-Jan-2023, Manuscript No. AMHSR-23-87167 (PQ); Editor assigned: 17-Jan-2023, Pre QC No. AMHSR-23-87167; Reviewed: 31-Jan-2023 QC No. AMHSR-23-87167 (R); Revised: 15-Mar-2023, Manuscript No. AMHSR-23-87167; Published: 22-Mar-2023
Citation: Vinothini S, et al. Current Focus on Utilization of UV-visible Spectroscopy in Multiple Pharma Research. Ann Med Health Sci Res. 2023;13:702-708.
This open-access article is distributed under the terms of the Creative Commons Attribution Non-Commercial License (CC BY-NC) (http://creativecommons.org/licenses/by-nc/4.0/), which permits reuse, distribution and reproduction of the article, provided that the original work is properly cited and the reuse is restricted to noncommercial purposes. For commercial reuse, contact reprints@pulsus.com
Abstract
The spectrophotometer is still being developed today, and it is used in a variety of fields, including science, medicine, crime scene investigation, and law enforcement. Beckman DU released the UV spectrophotometer in 1940. Researcher’s developed many techniques that measures both qualitative and quantitative which includes IR, mass spectroscopy and nuclear magnetic resonance spectroscopy. Among these techniques ultra-violet spectroscopy is simple, rapid and low cost technique. It is readily available in both academic and pharmaceutical industry. It substantially streamlines the procedure and, in addition to requiring only a few minutes for analysis, does not necessitate the use of a skilled individual. Main sign of this review focus on the utilization of UV-visible spectroscopy in various field of pharmacy such as pharmacognosy, pharmacology, pharmaceutics, pharmaceutical analysis, clinical and biochemical application. Here we discussed complete availability of easy laboratory procedure for the purpose of doing minor research work with the aid of UV-visible spectroscopy and its applications in the various pharmacy fields.
Keywords
UV visible spectrophotometer; Pharmacy; In vitro; Pharmaceutical field
Introduction
Data from UV-visible spectroscopy can provide both qualitative and quantitative details about a particular substance or molecule. Characterizing the absorption, transmission, and reflectivity of several significant materials, such pigments and other chemicals from plants, is useful [1]. Because of its availability, simplicity, adaptability, and variety of uses in a variety of disciplines, including as analytical chemistry and biochemistry, UV-visible analytical techniques have grown significantly in importance and are now widely used in many scientific fields throughout the world. Presently, it is required to decrease the number of samples and reagents used to generate analytical measurements, particularly for scary samples or toxic solvents [2]. In this review article, we discuss the function of UV in a number of pharmacy related fields, including pharmacognosy, pharmacology, pharmaceutics, pharmaceutical analysis, biochemical applications, and clinical uses. To evaluate the quantity of substances contained in the medication, a UV visible spectrophotometer is utilised for both qualitative and quantitative examination. Each compound's absorption characteristic varies in a certain way. Using a UV-visible spectrophotometer, you can measure how much light is passing through your sample. This provides the data on light absorption that identifies the various components included in medicinal drugs. This verifies the pharmaceutical compound's safety for human health as well as its quantification and purity.
Literature Review
A suitable drug solvent can be used to create a solution of many medications, whether they are in the form of raw materials or formulations. Using a spectrophotometer, the substance's absorbance may be measured and a qualitative analysis is carried out. In regulated laboratories, UV-visible spectrophotometers must undergo Performance Verification (PV) at installation and at predetermined intervals thereafter. Performance verification testing can be difficult to choose standards for, but it is necessary for the development of active pharmaceutical ingredients, dissolution testing, and quantification of nucleic acids and proteins (Table 1) [3].
Applications of UV visible spectroscopy
| S. no | Role | Interfernce |
|---|---|---|
| 1 | Detection of impurities | Due to sample impurities additional peak are seen, and they can be compared to those of a typical raw material. |
| 2 | Quantitative analysis | Compounds that absorb UV light can be measured quantitatively using UV absorption spectroscopy |
| 3 | Qualitative analysis | By comparing the absorption spectrum to the spectra of recognized substances, identification is accomplished. |
| 4 | Chemical kinetics | The reaction cell is exposed to UV rays and the variations in absorbance may be seen. |
| 5 | Detection of functional groups | Absence of band at a specific wavelength is seen as proof that a certain group is absent. |
| 6 | Pharmaceutical analysis | Many drugs are available in raw form or as formulations. They may be examined by measuring the absorbance at a certain wavelength. |
| 7 | Understanding the structures of organic molecules | It is possible to utilise UV spectroscopy to examine the chemical structure of organic substances, detect if unsaturation is present or not, and check for heteroatoms. It can be inferred from the peak locations and peak combinations. |
| 8 | Molecular weight determination | For instance, amine is transferred into amine picrate in order to calculate the molecular weight of amine. |
| 9 | In vitro studies | Anti-oxidant activity, anti-inflammatory activity, anti-hypertensive activity, anti-diabetic activity |
| 10 | Clinical application | UV visible spectroscopy can also be used to directly inspect precancerous growths, early stage invasive carcinomas of the head, anus, and cervix, as well as recurring chest wall sickness in breast cancer. It also provides a shallow depth of detection. |
Table 1: UV visible spectroscopy applications.
Pharmacological studies using UV-visible spectroscopy
In vitro studies:
The following are the pharmacological in vitro studies done by using UV spectroscopy.
Antioxidant activity
DPPH radical scavenging assay: Using the DPPH radical, we were able to evaluate the capacity to scavenge free radicals. The synthesis of 2, 2-diphenyl-1-picryldiazyl involves the use of a violet radical that is comparatively stable (DPPH). Because of environmental antioxidants, this radical is transformed into a yellow molecule (diphenylpicryl hydrazine). Absorbance at 517 nm [4,5] can be used to calculate the percentage of DPPH inhibition. There were several concentrations of the extracts to choose from: 50 g/mL, 250 g/mL, 350 g/mL, 500 g/mL, 750 g/mL, and 1000 g/mL. The 25 mg/L DPPH solution in methanol was diluted to 1950 mL with 50 mL of each concentration. The maximum absorbance was determined after 30 minutes of darkness using a spectrophotometer (model 4201/50, Zuzi, Navarra, Spain). To calculate the extracts' scavenging efficiency, we used an equation that gave us a percentage inhibition of DPPH [6].
DPPH inhibition (%)=Ablank–Asample/(Ablank) × 100
Ferric Reducing Antioxidant Power assay (FRAP)
The Ferric ion (Fe3+) is converted to the Ferrous ion (Fe2+) through a reduction-oxidation-reduction (FRAP) reaction involving the Potassium Ferricyanide Complex (III) (K3Fe(CN)6). Different concentrations of extracts (50 g/mL, 250 g/mL, 350 g/mL, 500 g/mL, 750 g/mL, and 1000 g/mL) were prepared. Absorbance at 700 nm [6,7] is measured to assess the response. The antioxidant activity of Ferric Thiocyanate (FTC) was measured using a modified version of the Oyaizu method [8]. Phosphate buffered saline was added to 0.1 ml of plant extract, and the mixture was then diluted to 2.5 ml (0.04 M; pH 7.4) A 1% (w/v) solution of potassium ferricyanide was used. Then we baked the mixture for 20 minutes at 50 degrees Celsius. Two and a half millilitres of a 10% (w/v) Trichloroacetic Acid (TCA) solution were added once the incubation period had concluded. The plant extract (0.1 ml), iron chloride (III) solution (0.5 ml, 0.1%), Phosphate-Buffered Saline (PBS; 0.04 M, pH 7.4), and potassium ferricyanide solution (1%, w/v) (2.5 ml, total) were mixed together. The reaction mixture was heated to 50 degrees celsius for 20 minutes. After 2.5 mL of a Trichloroacetic Acid (TCA) solution had been mixed in, a further 5.0 mL was added. The supernatant from each concentration was combined with 0.5 mL of 0.1%iron chloride (III), 2.5 mL of distilled water, and 2.5 mL of distilled water (FeCl3). In this test, we determined the absorbance at a wavelength of 700 nm. Ascorbic acid was employed as a benchmark in this study.
ABTS radical scavenging assay
Slight adjustments were made to the experimental protocol employed by Re, et al., to determine whether or not ABTS scavenged radical cations. A solution of 2.45 mM potassium persulfate and 7 mM ABTS was kept in the dark for an entire night to achieve this. A solution of ABTS containing radical cations. Three millilitres of the ABTS solution and the radical cation solution's initial absorbance value were combined to estimate the samples' capacity to neutralize free radicals [9]. The absorbance value was measured and examined again every minute for the following five minutes after the solution had been mixed for one minute. The degree of suppression was computed with the help of an equation.
Scavenging effect (%)=Ablank–Asample/(Ablank) × 100
Anti-inflammatory activity
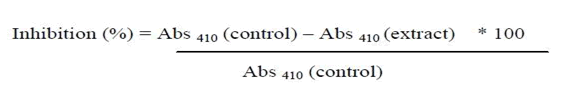
Bovine serum albumin denaturation method: To make 90.5 ml of test solution, combine 0.45 ml of BSA (5% w/v aqueous solution) with 0.05 ml of each of the test solution concentrations (100 g/ml, 200 g/ml, 400 g/ml, 600 g/ml, 800 g/ml, and 1000 g/ml) consists of 0.45 mL distilled water and 0.05 mL of the substance to be tested. Diclofenac sodium (100 g/ml, 200 g/ml, 400 g/ml, 600 g/ml, 800 g/ml, and 1000 g/mL) and Bovine Serum Albumin (BSA) (5% w/v) are present in an aqueous solution that makes up the standard solution (0.5 mL). The pH of each of these solutions was brought down to 6.3 with 1 N hydrochloric acid. Following 20 minutes incubation at 37ºC, the samples were heated for 3 minutes at 57°C. We looked at 2.5 ml of phosphate buffered water with a UV-visible spectrophotometer [10]. The following calculation was used to calculate the amount of protein denaturation that was avoided:
Percentage inhibition (%)=100-Absorbance of control-Absorbance of sample × 100/Absorbance of control
Egg albumin denaturation method
The reaction mixture (5.0 ml) consists of phosphate buffered saline (2.8 ml), fresh hen's egg albumin (2.0 ml), and a series of plant extract strengths (2.0 ml) (pH 6.4). Double distilled water was used as a control in the same amounts. The combinations were heated to 70°C for 5 minutes after incubation at 372°C for 15 minutes. After being cooled, their 660 nm absorbance was compared to that of a vehicle. In order to standardize the process of calculating absorbance, diclofenac was used as a reference drug and given the same treatment as the other drugs [11]. This formula was used to figure out how much protein denaturation inhibition was achieved.
Percentage inhibition (%)=100-Absorbance of control-Absorbance of sample × 100/Absorbance of control
Protein inhibition assay
The test sample (100 g/ml-500 g/ml) is added to a reaction mixture containing 0.06 mg of trypsin, 20 mM of Tris buffer (pH 7.4), and 1 ml (2 ml). At the end of the 5 minutes at 37 degrees celsius, 1 ml of the mixture was injected with a casein solution at 0.8% (w/v). It took another 20 minutes of incubation to fully develop the mixture. In a reaction mixture containing 0.06 mg of trypsin, 20 mM of Tris buffer (pH 7.4), and 1 ml of the test sample (100 g/ml-500 g/ml), the sample is added (2 ml). Once the 5 minutes at 37 degrees celsius were up, 1 ml of the mixture was injected with a 0.8% (w/v) casein solution.
Percentage inhibition (%)=100-Absorbance of control-Absorbance of sample × 100/Absorbance of control
Anti-hypertensive activity
Determination of percent inhibition of ACE-activity: A kit called the ACE Kit-WST assay was used to measure ACE's inhibitory activity. This assay relies heavily on Angiotensin-Converting Enzyme for its operation (ACE). Mostly released by endothelial cells of capillaries in the kidneys and lungs, this enzyme is a zinc containing nonspecific dipeptidyl carboxypeptidase that transforms the inactive octapeptide vasoconstrictor angiotensin I into the active form angiotensin II (EC 3.4.15.1). The amount of 3-hydroxybutyric acid generated is determined by spectrophotometric analysis at 450 nm. The proportion of ACE-I activity inhibition represented the sample's inhibitory activity.
The inhibitory activity of ACE (% inhibition rate)=((A Blank 1–A sample)/A Blank 1–Blank 2)) × 100.
Antidiabetic activity
Test to inhibit amylase activity: The different plant and chemical components were produced using 5% Diemthylsulfoxide (DMSO). Five hundred millilitres of compound was mixed with twenty millilitres of amylase (at a concentration of 0.5 mg/mL) and five hundred millilitres of 20 Mm sodium phosphate buffer for a ten minute incubation at 25°C (pH 6.8). After 15 minutes of pre-incubation, 500 mL of a 1% starch solution were added to each tube. Dinitrosalicyclic acid (1 mL) in a sodium phosphate buffer (0.02 M) was used to complete the procedure (pH 6.9). After this, the test tubes were placed in water for five minutes.
Before measuring the absorbance at 540 nm, 10 mL of distilled water was added to the reaction mixture. Mean results were obtained from studies conducted in triplicate. No plant derived chemicals, extracts, or fractions were used to construct the control samples [12]. Using the following formula, a percent inhibition of amylase activity was calculated.
Glucosidase activity inhibition assay
Using 5% dimethyl sulfoxide, the various plant and chemical fractions were created (DMSO). 80 L of the fraction or compound with a concentration of 100 g/mL (i.e., 8g) was mixed with 2.5 mL of 0.1 Na2CO3 to stop the reaction. Then, this combination was added to 20 L of glucosidase (0.01 mg/mL), and it was left to stay at 37°C for an incubation period. The absorbance at 400 nm was measured in order to ascertain the glucosidase activity. The average figures are from studies done in triplicate [12]. Using the equation, the amount of glucosidase activity inhibition was calculated.

Determination of glucose uptake by yeast cells
In this experiment, the regular cirillo method was used [13]. Commercial baker's yeast was dissolved in distilled water to create a 1% yeast suspension. Maintaining a steady 25°C throughout the night in the suspension. Separation of yeast cells from a suspension was performed the next day using a Microfuge 16 centrifuge equipped with an FX241.5P Rotor, 50/60 Hz, and 220 V-240 V for 5 minutes at 4200 rpm. A clear supernatant was obtained after the process was repeated until the pallet needed to be refilled with distilled water. Complete dissolution and addition to a plant extract with 1 mg w/v–5 mg w/v of Dimethyl sulfoxide resulted in a uniform mixture (DMSO). After the concentration of the mixture was increased, varying volumes of glucose solution (one millilitre each at 5 Mm, 10 Mm, and 25 Mm) were added. Then, after combining all the ingredients, they were left to incubate for 10 minutes at 37 degrees Celsius. To the combined glucose and extract, 100 litres of yeast suspension were added first. After a further 60 minutes of incubation at 37ºC, this mixture was vortexed. After incubating for 5 minutes at 3800 rpm, the glucose concentration was measured using a UV 5100B spectrophotometer with a 520 nm setting. At the same wavelength, we also measured the control's absorbance. The formula used to calculate the relative increase in uptake incorporates all of the chemicals present in the control solution in addition to the test sample. The antibiotic metronidazole was widely prescribed [14].
In vivo studies
The following are the pharmacological in vivo studies done by using UV-spectroscopy using in vivo blood samples.
Catalase (CAT)
Using Aebi's approach, catalase activity in erythrocyte lysate can be assessed. In a cuvette, there is 50 L of lysate, 1 mL of 30 mM H2O2, 2 mL of pH 7.0 phosphate buffer, and 2 ml of lysate. In a cuvette, you'll find 50 L of lysate, 1 ml of 30 mM H2O2, 2 mL of phosphate buffer with a pH of 7.0, and 2 mL of lysate. Catalase is measured in a spectrophotometer for 60 seconds at 240 nm. The molar extinction coefficient for H2O2 was used to calculate catalase activity, and it was found to be 43.6 M cm-1. When measuring activity in terms of units per milligramme of protein, one million moles of H2O2 are oxidised every minute.
Glutathione-S-Transferase (GST)
Glutathione-S-Transferase may play a physiological function in the initiation of detoxication of potentially alkylating substances, such as drugs with pharmacological effect. The enzymes catalyse the reaction between the chemicals and the SH group of glutathione, which reduces the reactivity of the electrophilic sites and makes the compounds more soluble in water. In a 1 mL reaction volume, 1 nM of GSt, 1 M of the substrate 1-chloro-2, 4-dinitrobenzene, and 6 mg of protein per mL of suitable cytosol form the reaction mixture (pH 6.5). The substrate is added, and the reaction is left to proceed for five minutes at 37°C [15,16]. The increase in absorbance at 340 nm was measured using spectrophotometry.
Superoxide Dismutase (SOD) method
The method may be used to measure a material's antioxidant activity and is thoroughly discussed by Mccord and Fridovich [17]. It is assumed to be present in the erythrocyte lysate isolated from the RBC solution containing 5% of the total cell count. Two milligrammes of pyrogallol, thirty milli grammes of ethylene diaminetetraacetic acid, and seventy-five milligrammes of Tris(hydroxymethyl)amino acid (HCl) are added to fifty millilitres (pH 8.2). Over the period of three minutes, a spectrophotometer reveals an increased absorbance at 420 nm. One unit of enzyme activity is equivalent to a 505-fold suppression of the rate of pyrogallol autoxidation, as assessed by the rate of change in absorbance per minute at 420 nm. To measure SOD activity, scientists utilise milligrammes of protein.
Anti-inflammatory activity
A well-established process was used to create CuO-NPs, and once the solution's colour changed, letting it stand at room temperature for 40 minutes. After that, while using a 200 nm-700 nm UV-visible spectral region, the sample's absorbance was estimated. A Shimadzu UV-1800 spectrophotometer was used in this work. CuO-NPs were created, as shown by the presence of their distinct surface plasmon peak at 420 nm and 1.25 au of absorbance. There were also a few tiny distortion peaks that may have been caused by the proteins that are involved in NP capping and reduction. The UV peaks amply supported the reduction of Cu2+ ions to CuO by B. monnieri macromolecules [18].
Results
Pharmacognostical studies using UV-visible spectroscopy
Phytochemicals analysis: The UV-visible spectrophotometer evolution 300 series (Thermo Fisher Scientific, Madison, USA) was used to identify the presence of alkaloids, flavonoids, phenolic acid, terpenoids, tannins, saponins, and carbohydrates by analysing the type of electronic transition of compounds between 200 nm and 800 nm. DPPH radicals neutralized by UV-visible light and total phenolic and flavonoid content were also measured [19].
Estimation of total phenolic contents
In order to determine the phenolic content of bark, leaves, sepals, fruits, and seeds, the Folin-Ciocalteu colorimetric method was used. It took 15 minutes for the ultrasonic extraction to complete, during which time 0.1 g of plant material was mixed with 10 mL of ethanol in a conical flask. After waiting 5 minutes for the mixture to settle, 2 mL of 7.5% Na2CO3, 10 mL of DW, 1 mL of ethanol extract, and 1 mL of FCR dilution 1:1 were added. After stirring the solution for an hour, it was analysed using a UV-vis spectrophotometer set to 765 nm. Using a calibration curve built between gallic acid content (0.5 g/mL-9.0 g/mL) and absorbance, the phenolic concentration in plant samples was calculated. Mean (SD) and Standard Deviation (SD) values for phenolic content were calculated from three independent tests and reported in milligrammes of gallic acid equivalent per gram of dry weight based plant sample (mgGAE/g sample).
Estimation of total flavonoid contents
Using a colorimetric method based on aluminum chloride, we were able to determine the overall concentration of flavonoids. Each plant sample weighted out to about 0.1 g. After filtering an ethanol extract, we combined it with 1 mL of solution and 0.3 mL of 5% NaNO2. After thoroughly mixing, 3 mL of a 10% AlCl3 and a 1 M NaOH solution were added. It was then left to sit for five minutes to allow the ingredients to fully combine. The total concentration of the solution was 10 mL DW. After letting the solution remain for 30 minutes at room temperature, the spectrophotometer reading was taken at 415 nm. The spectral absorbance at 415 nm was measured after the solution combination remained for 30 minutes at room temperature. Using the concentration range of 1 g/mL-10 g/mL and the absorbance value of Rutin, a standard calibration curve was also generated. For three repetitions, the results were shown as milligramme rutin equivalents (mgRUE/g sample) and Standard Deviations (SD).
Estimation of total alkaloid contents
The atropine standard solution was divided into accurately measured aliquots for transfer to different separatory funnels (0.4 ml, 0.6 ml, 0.8 ml, 1 ml, and 1.2 ml). A phosphate buffer at pH 4.7 and a BCG solution at 5 millilitres each were added and the mixture was shaken. The solution was then extracted with 1 ml, 2 ml, 3 ml, and 4 ml of chloroform, respectively. The extracts were diluted with chloroform and added to a 10 ml volumetric flask to create a better solution. Using a SHIMADZU UV-1800 Ultra Violet (UV) spectrophotometer, we compared the complex's absorbance in chloroform to that of a blank made in the same method minus the atropine [20].
Estimation of total tannins contents
After being dried at 5510ºC, the sample was crushed to fit through a screen with a 1 mm diameter. Blending 400 mg of the powdered material with 40 mL of diethyl ether containing 1% (v/v) acetic acid was the best way to extract the tannins. To aid in extraction, the mixture was placed on an electronic shaker for two hours after the supernatant was removed by hand after five minutes and 20 mL of 70% aqueous acetone was added. The substance was filtered via Whatman filter paper no. 1 before being flash-frozen at 4 degrees celsius for analysis. After the components were mixed, a plot of the tannic acid solution standard curve was generated. After the additions were made, the absorbance of the samples was measured at 715 nm, and a tannic acid standard curve was generated.
Discussion
Biochemical applications of UV-visible spectroscopy
Biochemists frequently use UV-visible spectrophotometers to learn about and identify various species and biochemical processes. Most biological substances absorb in the UV-visible range or convert to absorbent derivatives, so this method detects substance micro molar quantities and has many uses in this field. Comparative spectrophotometry or, to a lesser degree, derivative spectrophotometry can be used to reduce interferences when there is a substantial amount of background absorption, which, on the other hand, generally leads to interferences that are compound of interest [21].
Inorganic ion
Spectrophotometric techniques can be used to identify inorganic ions in biological systems if they are present at sufficiently high concentrations (a few micrograms per millilitre or more) and if other species in the medium absorb little or no light. Due to the extremely low quantities of several metals in biological systems, such as nickel, cadmium, chromium, and aluminium, UV-visible spectrophotometry frequently cannot distinguish between them. Inorganic ions need to be identified using UV-visible spectrophotometric analysis, which has to utilise a reagent that produces a coloured product containing the target species. The material may be intricate, absorbent (like lacquer), oxidised, or reduced, but it must be stable when measured experimentally. The ammonium ion is a common inorganic species detected by UV-visible spectrophotometry. Following its purification using the Kjeldahl technique, it can be quantified via spectrophotometry following a reaction with phenol and hypochlorite in the presence of nitroprusside ion. The discovery of indophenol, a blue compound having a maximum absorbance at 625 nm, made this possible.
Common organic compounds
While certain organic substances typically present in biological systems have substantial UV-visible absorption, others have little to no absorption and must be changed into a coloured molecule that has absorption. One of the organic substances whose intrinsic absorbance is sufficient for spectrophotometric measurement is chlorophyll. Using vanillin phosphate and sulphuric acid, a crimson substance of unknown composition is produced, and its absorbance is measured at 520 nm–530 nm, it is possible to spectrophotometrically quantify the amount of unsaturated lipids in blood serum.
Amino acids
Since amino acids absorb substantially in the near UV area, they may be directly identified. The main barrier to their measurement in biological systems is the presence of considerable input from other species. Derivative spectrophotometry can be used to reduce interferences to a great extent. The difference between phenylalanine and tryptophan may be seen in their second-derivative spectra at 250 nm-265 nm and 290 nm-299 nm, respectively. The analysis of amino acids frequently makes use of derivatization procedures. The reaction with ninhydrin-ascorbate is an example of this. To produce ammonium ion, amino acids undergo oxidative deamination when combined with ascorbic acid to form hydridantin (triketohydrindane hydrate). The maximum absorbance is at 405 and 575 nm when the ammonium ion condenses with the hydridantin.
Nucleic acids
Nucleic acids absorb a substantial quantity of light due to the existence of purine and pyrimidine bases, which are near to UV radiation. In general, the absorbance maxima of the five most common bases are similar because their energies are all close to one another, though their precise location does depend on pH. (Adenine 260 nm, Guanine 246 nm, Uracil 259 nm, Thymine 265 nm, and Cytosine 267 nm). This is because the bases in DNA and RNA contribute to a broad absorbance band between 240 nm and 280 nm, making it challenging to separate the specific contributions of each band in their spectra. Since the bases that make up nucleic acids ionise and cause noticeable variations in the spectra with pH, it is challenging to quantify nucleic acids using spectrophotometry [22].
Conclusion
The ultraviolet-visible spectrophotometer is simple to use and capable of speedy analysis. It is an extremely helpful approach for research that characterize organic and inorganic components in analytes, medications, food matrices, plant extracts, etc. in qualitative and/or quantitative ways. The scientific community has used this method in numerous subfields of food science and technology research, and its widespread adoption by premier facilities serving the food and medical sectors has been crucial to the success of efforts to safeguard the economy and the health of the general public. A crucial instrument in the domains of forensic science, medicine, and pharmacy is a UV-vis spectrophotometer. It is also commonly used in business and academia. In this paper mainly focusing on utilization of UV-vis spectrophotometer in the field of pharmacy and this provides complete availability of procedure for the purpose of doing different research work using UV-vis spectroscopy.
References
- Sahira B, Cathrine L. General techniques involved in phytochemical analysis. Int J Adv Res Chem Sci. 2015;2:25-32.
- Prisna JSL, Ornella MP. The importance of UV-vis spectroscopy: Application in food products characterization. J Food Nutr Res. 2018;1:1-5.
[Crossref]
- Shani U. Applications of UV-visible spectros. Scribd. 2018;1:1-2.
- SMACgig World. UV Spectrophotometry Identifies Compounds in Pharmaceuticals. SMAC gig Technologies, Bangalore Karnataka, India.
- Gig WORLD, Karnataka, India. 2010:1-8.
- Lu Y, Foo LY. Antioxidant and radical scavenging activities of polyphenols from apple pomace. Food Chem. 2000;68:81-85.
- Mechqoq H, Hourfane S, Yaagoubi ME, Hamdaoui AE, Msanda F, et al. Phytochemical Screening, and In vitro Evaluation of the Antioxidant and dermocosmetic activities of four moroccan plants: Halimium antiatlanticum, Adenocarpus Artemisiifolius, Pistacia lentiscus,Leonotis nepetifolia. Cosmetics. 2022;9:94-103.
- Gulcin I, Topal F, Sarikaya SBO, Bursal E, Bilsel G. Polyphenol contents and antioxidant properties of Medlar (Mespilus germanica L.). Rec Nat Prod. 2011;5:1-18.
- Oyaizu M. Studies on products of browning reaction. Jpn J Nutr. 1986:44:307–315.
- Re R, Pellegrini N, Proteggente A, Pannala A, Yang M, Rice EC. Antioxidant activity applying an improved ABTS radical cation decolorization assay. Free Radic Biol Med. 1999;26:1231–1237.
[Crossref] [Google Scholar] [PubMed]
- Vanlalhruaii C, Malsawmtluangi H, Lalhlenmawia. Evaluation of in vitro anti-inflammatory activity of the spadix of Colocasia affinis. Sci Vis. 2019;19:30–34.
[Crossref]
- Rodriguez AM, Gallardo EIO, Chavez CF, Carrillo JC, Moreno CR, Noris EMM, et al. Evaluation of the in vitro and in vivo antihypertensive effect and antioxidant activity of blue corn hydrolysates derived from wet-milling. Biotecnia. 2020;22:1-10.
- Alqahtani AS, Hidayathulla S, Rehman MT, Ali A, ElGamal, Al-Massarani S, et al. Alpha-amylase and alpha-glucosidase enzyme inhibition and antioxidant potential of 3-Oxolupenal and katononic acid isolated from Nuxia oppositifolia. Biomolecules. 2020;10:61-68.
[Crossref] [Google Scholar] [PubMed]
- Cirillo VP. Mechanism of glucose transport across the yeast cell membrane. J Bacteriol. 1962;84:485–491.
[Crossref] [Google Scholar] [PubMed]
- Rehman G, Hamayun M, Iqbal A, Islam SU, Arshad S, Zaman K, et al. In vitro antidiabetic effects and antioxidant potential of Cassia nemophila Pods. Bio Med Research International. 2018;1824790.
[Crossref] [Google Scholar] [PubMed]
- Alam MN, Bristi NJ, Rafiquzzaman M. Review on in vivo and in vitro methods evaluation of antioxidant activity. Saudi Pharm J. 2013;21:143-152.
[Crossref] [Google Scholar] [PubMed]
- McCord J, Fridovich I. Superoxide dismutase, an enzymic function for erythrocuprin. J Biol Chem. 1969;244:6049-6055.
[Google Scholar] [PubMed]
- Faisal S, Hasnain J, Abdullah, Ibrar A, Muhammad R, Zahid H, et al. In vivo analgesic, anti-inflammatory, and anti-diabetic screening of Bacopa monnieri-synthesized copper oxide nanoparticles. ACS Omega. 2022;7:4071−4082.
[Crossref] [Google Scholar] [PubMed]
- Tarun K, Patle, Kamlesh S, Ramsingh K, Seema U, Rajendra J, et al. Phytochemical screening and determination of phenolics and flavonoids In Dillenia pentagyna using UV–vis and FTIR spectroscopy. Spectrochim Acta A Mol Biomol Spectrosc. 2020; 242:118717.
[Crossref] [Google Scholar] [PubMed]
- Manjunath A, Mahadev B, Gundkalle, Nayak SU. Estimation of total alkaloid in Chitrakadivati by UV-spectrophotometer. Anc Sci Life. 2012;31:198-201.
[Crossref] [Google Scholar] [PubMed]
- Pratik DT, Prakash DP, Chandrashekhar KC. Quantitative estimation of Tannins From Pueraria tuberosa by UV spectrophotometry. Int J Pharm Sci Rev Res. 2016;37:210-212.
- Brown Q, Vishwanath K, Palmer GM, Ramanujam N. Advances in quantitative UV-visible spectroscopy for clinical and pre-clinical application in cancer. Curr Opin Biotechnol. 20:119-131.
[Crossref] [Google Scholar] [PubMed]


 The Annals of Medical and Health Sciences Research is a monthly multidisciplinary medical journal.