Evaluating Traditional Machine Learning Models for Predicting Diabetes Onset Using the Pima Indians Dataset
Received: 08-Jul-2024, Manuscript No. amhsr-24-140802; Editor assigned: 10-Jul-2024, Pre QC No. amhsr-24-140802 (PQ); Reviewed: 24-Jul-2024 QC No. amhsr-24-140802; Revised: 01-Aug-2024, Manuscript No. amhsr-24-140802 (R); Published: 07-Aug-2024
Citation: Nassiwa F, et al. Evaluating Traditional Machine Learning Models for Predicting Diabetes Onset Using the Pima Indians Dataset. Ann Med Health Sci Res. 2024;14:1010-1015.
This open-access article is distributed under the terms of the Creative Commons Attribution Non-Commercial License (CC BY-NC) (http://creativecommons.org/licenses/by-nc/4.0/), which permits reuse, distribution and reproduction of the article, provided that the original work is properly cited and the reuse is restricted to noncommercial purposes. For commercial reuse, contact reprints@pulsus.com
Abstract
Diabetes is a leading disease in the world. With the seriousness of diabetes and its complexity in diagnosis, we aimed to produce a model to help with prediction of onset of diabetes. Three models, logistic regression, gradient boosting and random forest were performed and evaluated to predict the onset of diabetes. A dataset of size 768 that includes information about some indian population were used. the population are specific to indian women that are at least 21 years old and of Pima Indian Heritage. Methods of standardizing including Synthetic Minority Oversampling Technique (SMOTE) and hyperparameter tuning are performed.
Random forest performed the best with an accuracy score of 81.8%, followed by gradient boosting (78%), and followed by logistic regression (76%). Glucose, BMI and age are the top predictors for Diabetes according to random forest feature importance. Because of the limited dataset we used in this dataset, more future available datasets are hoped to improve the accuracy of the models and give more information about the onset of diabetes. Moreover, this dataset is very specific to some group, future datasets with information about broader groups (including more age, gender and race) might give more insights about this issue.
Keywords
Diabetes Prediction; Body Mass Index (BMI), Insulin; Machine learning; Feature selection; Prima Indians Dataset
Introduction
The US population have diabetes and 96 million people that aged 18 years or older have prediabetes. Moreover, Diabetes is a major cause of blindness, kidney failure, heart attack, stroke and lower limb amputation. The normal tests for type 1 and type 2 diabetes and prediabetes are AIC (glycated hemoglobin) test, random blood sugar test, fasting blood sugar test and oral glucose tolerance test, according to one online survey, about 25% of all participants were misdiagnosed with diabetes, and the misdiagnosis was associated with risk for Diabetic ketoacidosis.
Therefore, due to this above information, this problem is interesting because it might be helpful for the diagnosis of diabetes. It provides a way for machines to diagnose diabetes. This problem and dataset provide a way for us to gain some perspective of diabetes. It looks at some features, like blood glucose, BMI and other factors to try to predict if a patient has diabetes or not. It can help with the prevalence of misdiagnosis of diabetes. Moreover, this problem can also be examined to help us find out which features are mostly related to the diagnosis of diabetes. Therefore, this problem is interesting because it provides us with a way to machine predicts the diagnosis of diabetes and a way to look at the features related to diabetes.
The proposed approach to tackle the problem
The selected supervised machine learning models to predict the onset of diabetes in the given dataset. Below is a list of models that we will use and compare their performance based on defined evaluation metrics (Accuracy, F1-score, Recall, Precision, RocAUC) [1].
• Logistic regression
• Boosting methods, gradient boosting is used
• bagging methods, random forests is used
This study will also explore feature selection approaches (forward selection) to select the best features for the prediction.
Comparing this approach to other competing methods
The above-selected models because the dataset is small, numerical, tabularly structured and works on classification problems. We will not use any deep learning methods because the number of observations is few (768) and the data is already tabularly structured thus no need to find a good vector representation [2].
Logistic regression makes no assumptions about the underlying distribution of the data and should be the first method to try for classification problems. It does not require a linear relationship between the target and predictors. Gradient boosting iteratively combines multiple decision trees removing the randomness seen in random forest and it is often more scalable. k nearest neighbors is sensitive to noise and missing data, does not work well with high dimensionality as it complicates the distance calculating process to calculate the distance for each dimension [3].
Random forests applies random sampling of predictors while performing bagging which addresses the problem that bagging often produces similar decision trees. it requires little to no data preprocessing and automatically handles overfitting. it is suitable for nonlinear problems and gives better results than decision trees. accuracy is usually high, it does not overfit with more features like other methods [4].
Key components of the approach and results with specific limitations
Data preprocessing and cleaning, data analysis/exploration, modeling, and evaluation of results. Limitations of the selected models include lack of data, most of the models perform best with large datasets and lack of interpretability most especially with gradient boosting [5].
Materials and Methods
Preliminaries
The Pima Indians Diabetes dataset is made up of eight independent variables which include pregnancies, glucose, blood pressure, skin thickness, insulin, bmi, diabetes pedigree function and age that can be used to predict the onset of diabetes, and one dependent variable, outcome that has binary data values with 0 meaning no diabetes and 1 meaning the woman is diabetic. The dataset contains 768 observations describing female patients, and all eight independent variables are of a numeric (int or float) data type (Table 1).
| Variable | Description |
|---|---|
| Pregnancies | Number of times pregnant |
| Glucose | Plasma glucose concentration 2 hours in an oral glucose tolerance test |
| Blood pressure | Diastolic blood pressure (mm Hg) |
| Skin thickness | Triceps skin fold thickness (mm) |
| Insulin | 2-Hour serum insulin (mu U/ml) |
| BMI | Body mass index (weight in kg/(height in m)^2) |
| Diabetes pedigree function | Diabetes pedigree function |
| Age | Age(Years) |
| Outcome | Class variable (0 or 1) 268 of 768 are 1(diabetic), the others are 0(non-diabetic) |
Table 1: Observations describing female patients.
The below is a summary of the basic statistic of the variables in the dataset (Figure 1).
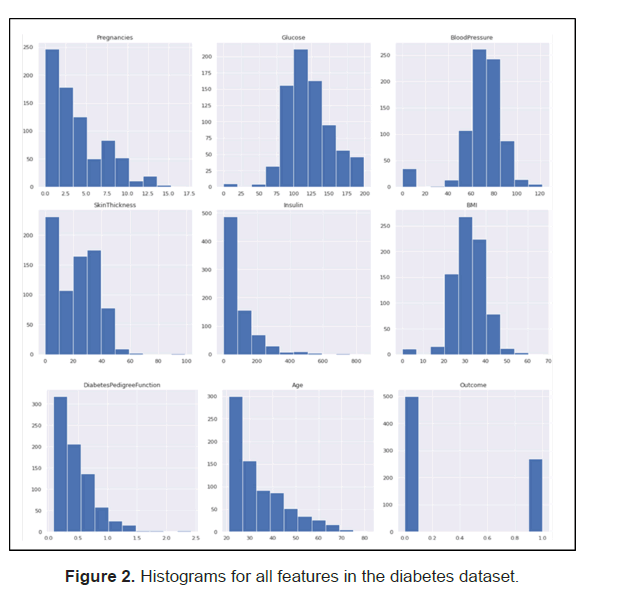
While analyzing the data, we observed that there were no nulls however some of the independent variables contained ‘0’ data entries that are not expected/feasible for the variables (Figure 2).
Below are the variables and their corresponding analysis findings
• Glucose-5 observations with 0 reading (0.7% of the observations)
• Blood Pressure-35 observations with 0 reading (5% of the observations)
• Skin Thickness-227 observations with 0 reading (30% of the observations)
• Insulin-374 observations with 0 reading, (49% of the observations)
• BMI-11 observations with 0 reading (1.4% of the observations)
Then decided to impute all the zero readings in the above variables with the column means as removing this data would have greatly reduce the number of observations in the dataset that is already small [6].
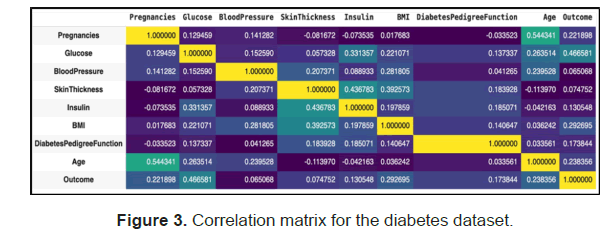
A correlation matrix was used to check for multicollinearity and how the independent variables relate to the Outcome and observed that glucose has the highest correlation to the outcome followed by bmi, age and Pregnancies and that all the features are positively correlated to the outcome/target feature (Figure 3).
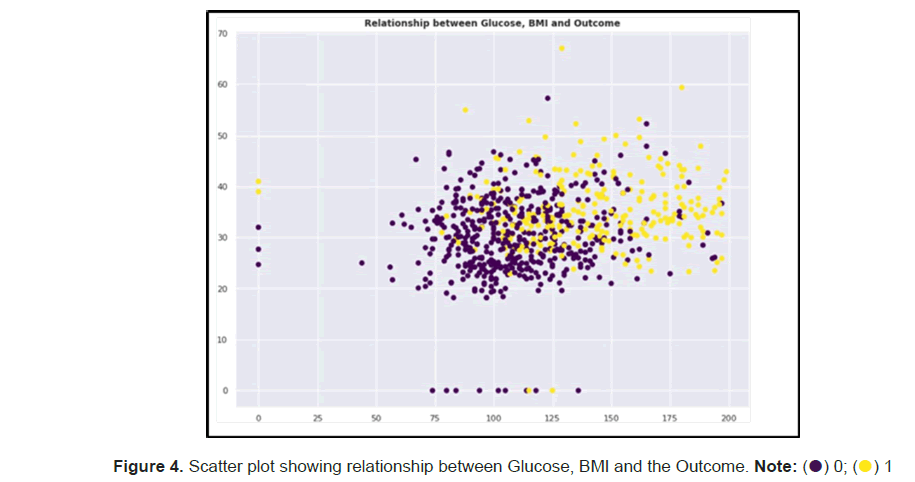
We created a scatter plot using the top two correlating features to the outcome and observed that the women with a high glucose and high BMI reading tend to be diabetic compared to their counterparts (Figure 4).
There were no outliers detected in the dataset per the box plots that the researchers ran for very feature [7].
We then split our dataset to have 80% training data and test on 20% of the data and we standardized the data using StandardScaler() to cater for any independent variables that had values that were greatly higher or lower than other values in the dataset. StandardScaler transforms the feature by subtracting the mean and dividing with the standard deviation. This way the feature also gets close to standard normal distribution with mean 0 (Figure 5).
The researchers then noticed that the dataset was imbalanced with 2:1 ratio on 0 and 1 Outcome values respectively. Usually for a dataset to be called imbalance a ratio of 10:1 is required however with the size of the data the 2:1 ratio is significant. To deal with the data imbalance, The researchers used SMOTE to create synthetic data points for the minority class since the dataset is small and does not suffer from high dimensionality. This helped increase the size of our training dataset and our models’ performances across the board (Figure 6).
The researchers used three models; logistic regression, gradient boosting and random forest for modeling our dataset due to reasons stated in the Introduction [8,9]. We completed cross validations to tune our models to identify the best hyperparameters for the model and evaluated the models on specific metrics including Accuracy, F1-score, Recall, Precision, RocAUC. We executed our project on Google Colab using Python 3.8.16.
Results
Logistic regression
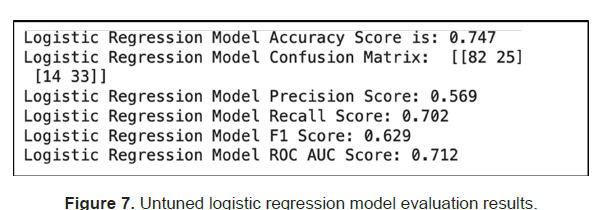
The researchers first used Logistic Regression to model our dataset and we got an accuracy of 75% on the test data. Out of the predicted positives (Precision), 57% were correct and out of the actual positives (Recall), 70% were correct. With a ROC AUC score above 0.5, the model performed better than random (Figure 7).
The researchers then used Grid Search to tune the model and observed a slight accuracy score improvement to 76% (Figure 8).
Gradient boosting
Secondly, It is tested using Gradient Boosting and we got an accuracy score of 78% on the test data before any hyperparameter tuning. Out of the predicted positives (Precision), 60% were correct and out of the actual positives (Recall), 81% were correct. With a ROC AUC score above 0.5, the model performed better than random (Figure 9).
We then used grid search to tune the model but observed no accuracy improvement (Figure 10).
Random forest
Finally, we tested using random forest and we got an accuracy score of 80% on the test data before any hyperparameter tuning. Out of the predicted positives (Precision), 65% were correct and out of the actual positives (Recall), 72% were correct. With a ROC AUC score above 0.5, the model performed better than random (Figure 11).
Then we tuned the random forest model with cross validation on the parameters n_estimators, max_depth and max_features. The researchers got a model with accuracy 0.818 with n_ estimators=300, max_depth=9 and max_features equal to the square root of number of features, we got an accuracy score of 0.818. Random forest seems to perform the best out of all the models we tested (Figure 12).
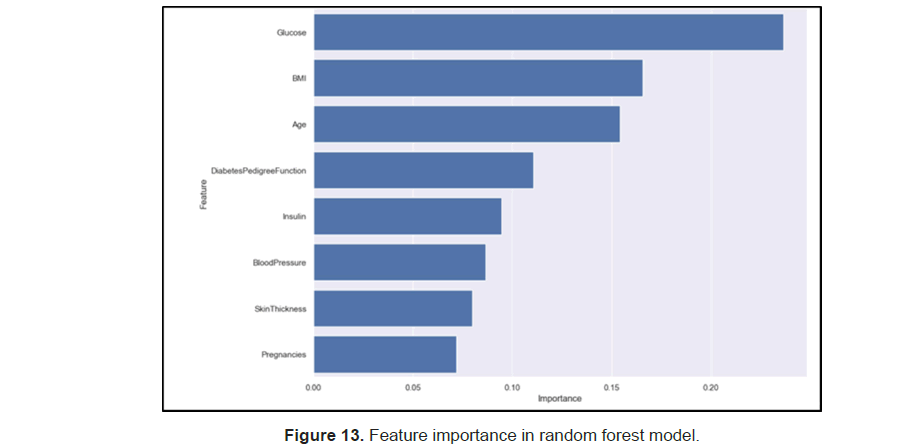
The researchers also did feature importance with the random forests and find out that glucose, BMI and age are the top three predictors for determining the onset of diabetes (Figure 13).
Discussion
As shown above, random forest performed the best out of all the three models we tested (random forest, gradient boosting and Logistic regression), and that are suitable for our data.
Random forest gave an accuracy score of 81.8%, it works better than gradient boosting since it’s an updated version of gradient boosting with random selected subset of features when performing bagging each time. It gave randomness to the features that we selected to build each decision tree and in a way, helps with preventing overfitting. Random forest also performs better than logistic regression because it uses sampling and subset selection, while logistic regression depends more on the features and overfits more easily.
Moreover, random forest also gave us some important information about which predictors are best for predicting the onset of diabetes. as we can see, glucose is the best predictor for onset of diabetes, followed by bmi, age and diabetes pedigree functions. glucose is the level of blood sugar, which are directly to the diabetes since diabetes are an inability to produce insulin, which are for processing blood sugar. BMI is the second predictor because overweight individuals are less sensitive to insulin and thus an important predictor for diabetes. People who are older have more insulin resistance, thus producing less insulin, which is also related to diabetes. Other features also help with prediction of diabetes.
Our results gave around 82% accuracy with random forest. Random forest also seems to perform the best out of all models in the current trend for classification problem in the machine learning field. Our accuracy score was only 77% before the researchers performed the SMOTE method, which helps with the data imbalance in the original data. It improved from 77% to 82% after performing SMOTE method.
However, The data were not as good at predicting because of the limited dataset the researchers have. Such model can probably perform better with more data provided in the future and can be a useful tool in the medical field.
Conclusion
Three machine learning models including logistic regression, gradient boosting and random forest are selected and performed to determine the best one for predicting the onset of diabetes using the Pima Indian Diabetes dataset. The researchers used Python 3.7 and Google Colab to perform basic exploratory data analysis, preprocessed the data (splitting train/test sets, applying SMOTE to help with data imbalance and standardizing the data using scalar method), ran and trained the models using hyperparameters tuning, and use them to predict target variable in the test data set, and evaluated the results for each model.
All the three models performed better after standardizing and applying the SMOTE method to the training data. Random forest emerges as the best model with an accuracy score of 82%, followed by gradient boosting with accuracy score 78% and logistic regression with accuracy score 76% came in last. we were shooting for an accuracy score of 85% but we faced limitation reaching this target due to the few observations in the dataset.
References
- Learning, UCI Machine. “Pima Indians Diabetes Database” Kaggle. 2022
- Centers for Disease Control and Prevention. National Diabetes Statistics Report. CDC. 2022.
- World Health Organization (WHO). Diabetes. 2022
- Mayo Foundation for Medical Education and Research. Diabetes. Mayo Clinic. 2022.
- Muñoz C, Floreen A, Garey C, Karlya T, Jelley D, et al. Misdiagnosis and diabetic ketoacidosis at diagnosis of type 1 diabetes: Patient and caregiver perspectives. Clin Diabetes. 2019; 37: 276–281.
- Juvenile Diabetes Research Foundation (JDRF). The complexity of diagnosing type 1 diabetes. 2022.
- Megan D. A Guide to EDA in Python. Medium. Level Up Coding. 2022.
- Choudhary I. Pima Indian Diabetes Prediction. Medium. Towards Data Science. 2020.
- Learning, UCI Machine. Pima Indians Diabetes Database. Kaggle, 2016.


 ) 0; (
 ) 1
) 1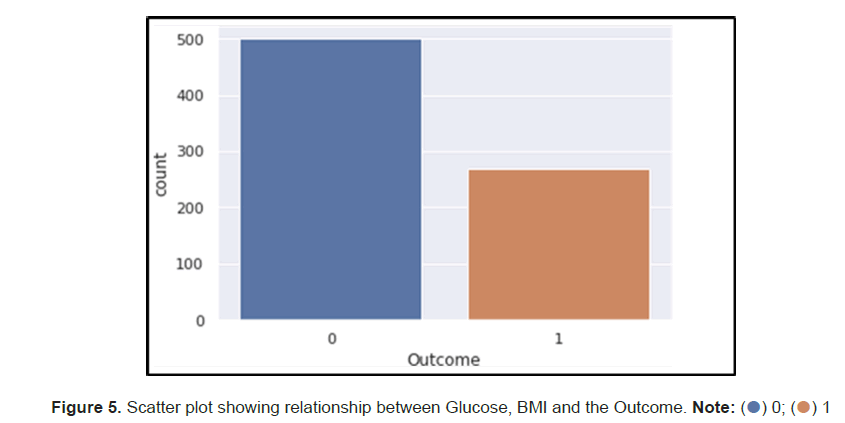
 ) 0; (
 ) 1
) 1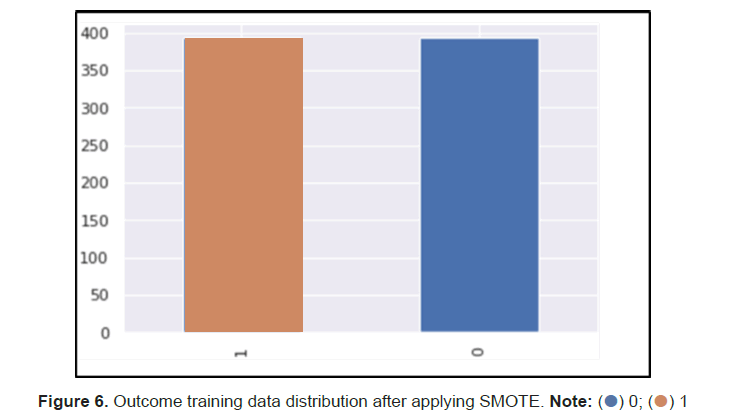




 The Annals of Medical and Health Sciences Research is a monthly multidisciplinary medical journal.