
Evaluation of Psychometric Properties of the Malay Version Perceived Stress Scale in Two Occupational Settings In Malaysia
- *Corresponding Author:
- Dr. Sami Abdo Radman Al?Dubai
Department of Community Medicine, International Medical University, No. 126, Jln Jalil Perkasa 19, Bukit Jalil, 57000 Kuala Lumpur, Malaysia
E?mail: samidobaie@yahoo.com
Abstract
Background: The 10‑item version of Perceived Stress Scale (PSS‑10) is a widely used tool to measure stress. The Malay version of the PSS‑10 has been validated among Malaysian Medical Students. However, studies have not been conducted to assess its validity in occupational settings. Aim: The aim of this study is to assess the psychometric properties of the Malay version of the PSS‑10 in two occupational setting in Malaysia. Subjects and Methods: This study was conducted among 191 medical residents and 513 railway workers. An exploratory factor analysis was performed using the principal component method with varimax rotation. Correlation analyses, Kaiser‑Meyer‑Olkin, Bartlett’s test of Sphericity and Cronbach’s alpha were obtained. Statistical analysis was carried out using statistical package for the social sciences version 16 (SPSS, Chicago, IL, USA) software. Results: Analysis yielded two factor structure of the Malay version of PSS‑10 in both occupational groups. The two factors accounted for 59.2% and 64.8% of the variance in the medical residents and the railway workers respectively. Factor loadings were greater than 0.59 in both occupational groups. Cronbach’s alpha co‑efficient was 0.70 for medical residents and 0.71 for railway workers. Conclusion: The Malay version of PSS‑10 had adequate psychometric properties and can be used to measure stress among occupational settings in Malaysia.
https://marmarisinvestments.com
https://realestateinmarmaris.com
https://balloonsdocia.com
https://cappadociahotairballoon.org
Keywords
Factor structure, Malaysia, Occupational, Perceived stress scale, Psychometric properties, Validity
Introduction
The 10‑item version of Perceived Stress Scale (PSS‑10) is a widely used tool to measure stress. It has shown adequate validity and reliability.[1] The PSS‑10 has been translated and validated in many languages including Japanese, Portuguese, Thai, Chinese, Greek and Malay.[1‑6]
There is a need to investigate the psychometric properties of the Malay version of PSS‑10 among occupational settings in Malaysia as such a study has yet to be conducted.
The current study is the first in Malaysia aimed at assessing the psychometric properties of the Malay version of PSS‑10 among occupational groups.
Subjects and Methods
Participants and study setting
This study recruited 191 medical residents from a Malaysian general hospital and 513 railway workers at the country’s main depot in Kuala Lumpur, Malaysia. Respondents were informed about the objectives and benefits of the study. Confidentiality was assured and written informed consent was obtained from the participants. The research protocol was approved by the Ethics Committee of the National Institutes of Health, Ministry of Health Malaysia. The study was conducted between December 2012 and March 2013.
Instruments
The Malay version of the PSS‑10 used in this study was the same validated version used in a previous study conducted among Malaysian Medical Students.[6] The PSS‑10 measures the degree to which one perceives aspects of one’s life as stressful. It has a 5‑point Likert scale and response ranged from 0 (never) to 4 (very often), indicating how often they have felt within the past month. Total scores range from 0 to 40, with higher scores indicating greater perceived stress.[7] Six out of 10 items of the PSS‑10 were considered negative (1, 2, 3, 6, 9 and 10) and the remaining four as positive (4, 5, 7 and 8), representing “perceived distress” and “perceived coping,” respectively.
Data analysis
All statistical analysis was performed using statistical package for the social sciences version 16 software (SPSS, Chicago, IL, USA). Total scores of PSS‑10 were obtained by summing across all the 10 items after reversing the scores on the four positive items. Test of normality was carried out. An exploratory factor analysis of the 10‑item scale was performed using principal component method with varimax rotation.[3,8] Correlation analyses, Kaiser‑Meyer‑Olkin and Bartlett’s test of Sphericity were used. Cronbach’s alpha was used to test the internal consistency of the scale.
Results
Socio‑demographic characteristics
The mean standard deviation (SD) age of medical residents was 26.5 (1.6) years and 55.5% (106/191) were females. The mean (SD) age of railway workers was 41.4 (10.7) years and 74.9% (384/513) were male. The mean (SD) of daily working hours for medical residents was 9.3 (0.9) and the working hours ranged from 8.4 to 12.9 h. The mean (SD) daily working hours for railway workers was 8.4 (0.9) h and they ranged from 2.0 h to 8.0 h [Table 1].
| Occupation | N | (%) |
|---|---|---|
| Medical residents (N=191) | ||
| Gender | ||
| Male | 85 | 44.5 |
| Female | 106 | 55.5 |
| Age | ||
| ≤24 | 17 | 8.9 |
| 25‑27 | 125 | 65.4 |
| ≥28 | 49 | 25.7 |
| Daily working hours | ||
| Mean (SD) | 9.3 (0.9) | |
| Minimum | 8.4 | |
| Maximum | 12.9 | |
| Railway workers (N=513) | ||
| Gender | ||
| Male | 384 | 74.9 |
| Female | 129 | 25.1 |
| Age | ||
| 20‑34 | 157 | 30.6 |
| 35‑49 | 177 | 34.5 |
| ≥50 | 179 | 34.9 |
| Daily working hours | ||
| Mean (SD) | 8.4 (0.9) | |
| Minimum | 8.0 | |
| Maximum | 12.0 |
SD: Standard deviation
Table 1: Socio‑demographic and work characteristics of the medical residents and railway workers
Distribution of PSS‑10 item scores for medical residents and railway workers
For all the 10 items of PSS‑10, the response ranged from 0 (never) to 4 (very often). Among the 191 medical residents, 2.6% (5/191) to 11.5% (22/191) state a Score of 0 while 1.0% (2/191) to 3.7% (7/191) states a Score of 4 [Table 2]. With respects to the 513 railway workers, workers, 3.9 (20/513) to12.5% (64/513) stated a score of, while for the Score of (4), the range was 1.9% (10/513) to 8.8% (43/513) [Table 3].
| Item | Score n (%) | ||||
|---|---|---|---|---|---|
| 0 | 1 | 2 | 3 | 4 | |
| 1 | 10 (5.2) | 20 (10.5) | 122 (63.9) | 33 (17.3) | 6 (3.1) |
| 2 | 13 (6.8) | 36 (18.8) | 112 (58.6) | 23 (12.0) | 7 (3.7) |
| 3 | 9 (4.7) | 21 (11.0) | 121 (63.4) | 38 (19.9) | 2 (1.0) |
| 4 | 15 (7.9) | 76 (39.8) | 83 (43.5) | 10 (5.2) | 7 (3.7) |
| 5 | 5 (2.6) | 66 (34.6) | 107 (56.0) | 6 (3.1) | 7 (3.7) |
| 6 | 9 (4.7) | 54 (28.3) | 107 (56.0) | 19 (9.9) | 2 (1.0) |
| 7 | 22 (11.5) | 58 (30.4) | 91 (47.6) | 13 (6.8) | 7 (3.7) |
| 8 | 6 (3.1) | 55 (28.8) | 116 (60.7) | 11 (5.8) | 3 (1.6) |
| 9 | 6 (3.1) | 31 (16.2) | 116 (60.7) | 35 (18.3) | 3 (1.6) |
| 10 | 14 (7.3) | 51 (26.7) | 110 (57.6) | 14 (7.3) | 2 (1.0) |
PSS: Perceived stress scale
Table 2: Distribution of medical residents scores on the PSS‑10 (n=191)
| Item | Score n (%) | ||||
|---|---|---|---|---|---|
| 0 | 1 | 2 | 3 | 4 | |
| 1 | 56 (10.9) | 59 (11.5) | 303 (59.1) | 55 (10.7) | 40 (7.8) |
| 2 | 64 (12.5) | 72 (14.0) | 310 (60.4) | 40 (7.8) | 27 (5.3) |
| 3 | 45 (8.8) | 56 (10.9) | 309 (60.2) | 60 (11.7) | 43 (8.4) |
| 4 | 40 (7.8) | 102 (19.9) | 326 (63.5) | 32 (6.2) | 13 (2.5) |
| 5 | 27 (5.3) | 84 (16.4) | 349 (68.0) | 43 (8.4) | 10 (1.9) |
| 6 | 20 (3.9) | 68 (13.3) | 337 (65.7) | 63 (12.3) | 25 (4.9) |
| 7 | 48 (9.4) | 96 (18.7) | 310 (60.4) | 46 (9.0) | 13 (2.5) |
| 8 | 23 (4.5) | 92 (17.9) | 355 (69.2) | 30 (5.8) | 13 (2.5) |
| 9 | 23 (4.5) | 71 (13.8) | 351 (68.4) | 45 (8.8) | 23 (4.5) |
| 10 | 30 (5.8) | 70 (13.6) | 358 (69.8) | 34 (6.6) | 21 (4.1) |
PSS: Perceived stress scale
Table 3: Distribution of railway workers scores on the PSS‑10 (n=513
Internal consistency of PSS‑10
Cronbach’s alpha co‑efficient for medical residents were 0.70 for the total scale, 0.87 for the first factor and 0.73 for the second factor. Cronbach’s alpha coefficient for railway workers was 0.71 for the total scale, 0.88 for the first factor and 0.81 for the second factor. The analysis showed that the value of Cronbach’s alpha did not improve despite items elimination.
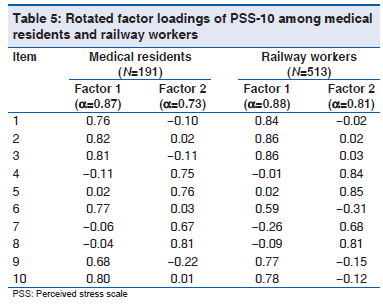
Factor structure and construct validity of PSS‑10 item
The principal component analysis with varimax rotation of all 10 items in the PSS‑10 scale yielded two factors with initial eigenvalues >1 in both medical residents and railway workers. The two‑factor solution accounted for 59.2% and 64.8% of the variance in the medical residents and the railway workers respectively. The first factor accounted for 37.3% of the variance in medical residents and 40.7% in railway workers [Table 4]. Factor loading of items ranged from 0.59 to 0.86. The second factor accounted for 21.9% and 24.1% of the variance in medical residents and railway workers respectively. Factor loadings ranged from 0.67 to 0.84. The item’s share of communality for one factor was at least 20% higher than its share of communality for the other factor [Table 5].
| Occupational group | Factor | Initial eigen values (total) | Extraction sums of squared loadings variance (%) | Total | Variance(%) | Cumulative(%) |
|---|---|---|---|---|---|---|
| Medical residents | 1 | 3.732 | 37.3 | 3.732 | 37.3 | 37.3 |
| 2 | 2.195 | 21.9 | 2.195 | 21.9 | 59.2 | |
| Railway workers | 1 | 4.072 | 40.7 | 4.072 | 40.7 | 40.7 |
| 2 | 2.405 | 24.1 | 2.405 | 24.1 | 64.8 |
PSS: Perceived stress scale
Table 4: Total variance explained; principal component analysis of the PSS‑10 among medical residents and railway workers
Discussion
The current study is the first in Malaysia that aimed at assessing the psychometric properties of the Malay version of PSS‑10 among occupational groups in Malaysia namely: Medical residents and railway workers. The findings of this study support the reliability and validity of the Malay version of PSS‑10.
The factor analysis yielded two factors with initial eigenvalues > 1 in both medical residents and railway workers. Here, the minimum acceptable value for factor loading was considered to be 0.30.[9] The two‑factor solution accounted for 59.2% and 64.8% of the variance in the medical residents and the railway workers respectively. A previous study in Malaysia among medical students found that the Malay version of PSS‑10 had two factors and these factors accounted for 57.8% of the variance.[7]
Factor loading of items ranged from 0.68 to 0.82 for medical residents and 0.59‑0.86 for railway workers. For all items in both occupational groups, factor loadings were greater than 0.59 and none of the items loaded significantly onto the second factor. These findings are comparable with that found by a previous study.[7] In 1988, Cohen and Williamson, found that the factor loadings of the scale items were 0.42 and higher. According to Cohen’s original analysis, the two factors accounted for 25.9% and 15.7% of the variance, respectively.[10] In this study, the factor loadings for all items were high and ranged between 0.59 and 0.86. Previous research on different language versions of the PSS‑10 identified that the PSS‑10 had two latent factors and they accounted for 52% and 58% of the variance respectively. They had also reported a minimum factor loading of 0.32 and a maximum of 0.88.[3,11‑14]
In this study, the first factor included items that were negatively worded (e.g., been upset, unable to control things, felt nervous and stressed) and the second factor reflected positively worded items (e.g., able to control irritation and ability to handle personal problems). The first factor was labelled ‘‘perceived distress” and the second factor was labelled ‘‘perceived coping.”[15] The Cronbach’s alpha coefficient in this study was 0.70 for medical residents and 0.87 for railway workers. These findings are comparable to previous studies from Malaysia and overseas.[6,7]
Cross‑cultural research methodologies have delineated significant gaps on health outcomes globally as most measurements were developed in English; hence there were relatively limited tools in non‑English‑speaking cultures.[16] The evaluation of psychometric properties of the Malay version PSS‑10 in this study will enable researchers in the future to use a validated measure of stress among other occupational groups and settings. Generalization of the results of this study is possible due to the adequacy of the sample size and the inclusion of diverse and heterogeneous occupational groups (professional doctors from the hospital and railway workers, which include blue and white collar workers). A possible limitation in this study was the absence of the concurrent and predictive validity assessment, which is recommended for future studies.
Conclusion
This study found that the Malay version of the PSS‑10 is a valid instrument to measure stress among medical residents and railway workers in Malaysia.
Recommendations
Future research should assess the concurrent and the predictive validity of this scale.
Source of Support: Nil.
Conflict of Interest: None declared.
References
- Remor E. Psychometric properties of a European Spanish version of the perceived stress scale (PSS). Span J Psychol 2006;9:86‑93.
- Mimura C, Griffiths P. A Japanese version of the perceived stress scale: Cross‑cultural translation and equivalence assessment. BMC Psychiatry 2008;8:85.
- Reis RS, Hino AA, Añez CR. Perceived stress scale: Reliability and validity study in Brazil. J Health Psychol 2010;15:107‑14.
- Wongpakaran N, Wongpakaran T. The Thai version of the PSS‑10: An Investigation of its psychometric properties. Biopsychosoc Med 2010;4:6.
- Andreou E, Alexopoulos EC, Lionis C, Varvogli L, Gnardellis C, Chrousos GP, et al. Perceived stress scale: Reliability and validity study in Greece. Int J Environ Res Public Health 2011;8:3287‑98.
- Al‑Dubai SA, Alshagga MA, Rampal KG, Sulaiman NA. Factor structure and reliability of the Malay version of the perceived stress scale among Malaysian medical students. Malays J Med Sci 2012;19:43‑9.
- Cohen S, Janicki‑Deverts D, Miller GE. Psychological stress and disease. JAMA 2007;298:1685‑7.
- Goz F, Geckil E. Nursing students professional behaviors scale (NSPBS) validity and reliability. Pak J Med Sci 2010;26:938‑41.
- Chaaya M, Osman H, Naassan G, Mahfoud Z. Validation of the Arabic version of the Cohen perceived stress scale (PSS‑10) among pregnant and postpartum women. BMC Psychiatry 2010;10:111.
- Cohen S, Lichtenstein E. Perceived stress, quitting smoking, and smoking relapse. Health Psychol 1990;9:466‑78.
- Orucu M, Demir A. Psychometric evaluation of perceived stress scale for Turkish University student. Stress Health 2008;25:103‑9.
- Mimura C, Griffiths P. A Japanese version of the perceived stress scale: Translation and preliminary test. Int J Nurs Stud 2004;41:379‑85.
- Mitchell AM, Crane PA, Kim Y. Perceived stress in survivors of suicide: Psychometric properties of the perceived stress scale. Res Nurs Health 2008;31:576‑85.
- Yu R, Ho SC. Psychometric evaluation of the perceived stress scale in early postmenopausal Chinese women. Psychology 2010;1:1‑8.
- Al-Dubai SAR, Barua A, Ganasegeran K, Jadoo SA, Krishna G Rampal KG. Concurrent Validity of the Malay Version of Perceived Stress Scale (PSS-10). ASEAN Journal of Psychiatry. 2014;15:8-13.
- Gillani SW, Syed SA, Sari YO, Sarriff A, Amin A, Baig M. Perceived stress scale psychometric validation for Malaysian diabetic patients. Br J Pharm Res 2011;1:156‑63.


 The Annals of Medical and Health Sciences Research is a monthly multidisciplinary medical journal.