Hemolyzed Samples Should be Processed for Coagulation Studies: The Study of Hemolysis Effects on Coagulation Parameters
- *Corresponding Author:
- Dr. Sachin Kolte
Department of Pathology, R. No. 208, 2nd Floor, Casualty Building, Safdarjang Hospital, New Delhi, India.
E-mail: drsachinkolte@gmail.com
Citation: Arora S, Kolte S, Dhupia JS. Hemolyzed samples should be processed for coagulation studies: The study of hemolysis effects on coagulation parameters. Ann Med Health Sci Res 2014;4:233-7.
Abstract
Background: Rejecting hemolyzed specimens received for coagulation studies is advised by the Clinical and Laboratory Standards Institute. Receiving such specimens is a common phenomenon in many laboratories. The true impact of hemolysis on coagulation studies is little studied in clinical practice. Aim: The aim of this work is to study the changes occurring in readings of prothrombin time (PT) and activated partial thromboplastin time (aPTT) in hemolyzed samples. Subjects and Methods: A total of 45 blood samples were collected from two groups of healthy donors and patient population. Samples were run for PT and aPTT and then were hemolyzed and again rerun for PT and aPTT. GraphPad Prism 5 (Version 5, USA) was the software used for statistical analysis and paired “t” test was applied with significance level at 0.05. Results: There was trend of increase in the readings of PT and aPTT in normal population and there was trend of decrease in the reading in patient population. The difference between paired samples from group one was not statistically significant, but it was significant in samples from second group. Conclusion: Samples sent for routine screening of coagulation studies with visible hemolysis can be processed for coagulation. There was no difference observed in hemolyzed and non‑hemolyzed samples.
Keywords
Bleeding disorders, Coagulation, Diagnostics, Hematology
Introduction
Receiving hemolytic specimens for laboratory tests is a common phenomenon in many of the clinical laboratories and it is one of the important factors that affect pre-analytical errors in many of these laboratories.[1-6] Collection of blood is a first step in good quality of reporting in coagulation studies. In coagulation assays rejection of hemolyzed samples is commonly recommended by testing device manufacturers and accrediting organizations. The clinical and Laboratory Standards Institute, in its guidelines for prothrombin time (PT) and activated partial thromboplastin time (aPTT) testing, states that samples with visible hemolysis should not be used because of possible clotting factor activation and interference with end point measurement interference.[7] Rejections of these samples create significant delays in the treatment and disposition of patients in the emergency department. The additional cost is incurred per re-collected specimen, adding to the overall cost of laboratory operation.[2] The true impact of hemolysis on coagulation studies is little studied in clinical practice. Therefore this study was planned with the aim to study the changes in the readings of PT and aPTT in hemolyzed and non-hemolyzed blood samples.
Subjects and Methods
Volunteers were selected on the basis of a homogenous range of values for white blood cell count (4.5-8.0 × 10³ cells/μl), platelet count (119-280 × 103 cells/μl) and hemoglobin concentration (12.5-15.6 g/dl) for expected normal coagulation values.
The blood samples were collected in citrated vacuum containers in the proportion of 1:9 parts of sodium citrate of 3.2 gm/dl concentration. After collection the tube was gently mixed by inverting it 4-6 times. Samples were run for PT and aPTT on ACL Elite pro, fully automated coagulometer run on the principle of light scattering by clot formation. Reagents supplied with the machine were used. After the test; the samples were subjected to in vitro hemolysis.
The samples were hemolyzed by rapid aspiration of about one ml of blood into syringe with a 23 G needle followed by strong expulsion back into the test tube, repeated for 5 times.
Then the samples were kept at room temperature for 3 h to simulate specimen transportation time. The samples were again re run on the same instrument for PT and aPTT. The hemolysis was assessed according to the color chart as in Figure 1.[8] The samples were labeled as hemolyzed when they were graded as > 100 mg/dl. The second group was selected from the samples, which showed increase in the readings of PT and aPTT. These samples belonged to patients who were admitted and majority of them were from intensive care unit. Samples were collected by a clean venipuncture from a vein different and distant from the vein having intravenous cannula. These samples were subjected to hemolysis and testing was carried out in same manner as those with the first group. The approval from ethics committee was taken for drawing blood samples from volunteers.
Statistical evaluation
GraphPad Prism 5 was the software used for statistical analysis and paired “t” test was applied with significance level at 0.05. Differences between coagulation measurements on hemolyzed and non-hemolyzed specimens were performed using paired t-tests. The mean of readings of PT and aPTT were taken, standard deviation was calculated. P < 0.05 was considered as statistically significant.
Results
A total of 45 samples were collected for testing; 28 from group one of normal volunteers and 17 from the group of patients. The normal range for PT was defined as 9-16 s and normal range for aPTT was defined as 24-40 s. The mean of readings of samples in group one and two are shown in Tables 1 and 2 respectively. Readings of individual samples in normal volunteers and patient group are given in Tables 3 and 4 respectively.
| Parameters | Before hemolysis | After hemolytic | t value | P value | Significance | ||
|---|---|---|---|---|---|---|---|
| Mean (s) | SD | Mean (s) | SD | ||||
| PT | 12.7 | 2.0 | 13.4 | 4.1 | 1.01 | 0.64 | Not significant |
| aPTT | 31.7 | 5.1 | 35.4 | 12.9 | 1.53 | 0.14 | Not significant |
Table 1: Comparison of PT, INR and aPTT in samples of normal volunteers
| Parameters | Before hemolytic | After hemolytic | t value | P value | Significance | ||
|---|---|---|---|---|---|---|---|
| Mean (s) | SD | Mean (s) | SD | ||||
| PT | 25.00 | 25.4 | 19.00 | 6.7 | 2.50 | 0.02 | Significant |
| aPTT | 40.5 | 15.2 | 31.2 | 6.0 | 2.49 | 0.02 | Significant |
Table 2: Comparison of PT and aPTT in patients’ samples
| PT in seconds | aPTT in seconds | ||
|---|---|---|---|
| Before | After | Before | After |
| hemolysis | hemolysis | hemolysis | hemolysis |
| 10.9 | 9.8 | 32.9 | 29.4 |
| 11 | 11.2 | 27.9 | 27.3 |
| 12.6 | 13.4 | 39.9 | 47.7 |
| 11.4 | 12.6 | 25.6 | 38.9 |
| 9.9 | 10.1 | 28.9 | 27.7 |
| 12.4 | 11.3 | 36.2 | 30.3 |
| 12.3 | 17.3 | 30.9 | 49.8 |
| 11.1 | 11.7 | 25.3 | 30.9 |
| 10.8 | 12.1 | 24.9 | 33.8 |
| 14.4 | 13.8 | 38.4 | 33.2 |
| 16 | 14.1 | 35.2 | 68.5 |
| 16 | 14.5 | 28.1 | 24.6 |
| 15.9 | 14.5 | 24.1 | 33.4 |
| 15.8 | 15.2 | 40 | 41.9 |
| 15.9 | 31.5 | 32 | 31.1 |
| 15.8 | 15 | 32 | 33.9 |
| 15.1 | 14.5 | 29.5 | 28.2 |
| 12.2 | 11.3 | 39 | 25.7 |
| 13 | 10.8 | 39 | 23 |
| 11.5 | 11.2 | 27.2 | 22.7 |
| 11.8 | 11.4 | 39.5 | 40.4 |
| 11.6 | 14.1 | 29.6 | 46.1 |
| 11.6 | 11.3 | 28.6 | 28.8 |
| 11.4 | 10.8 | 32.7 | 31.2 |
| 11.4 | 11.1 | 24.6 | 25.8 |
| 10.6 | 11.3 | 33.6 | 34.6 |
| 10.9 | 10.4 | 29.3 | 24.7 |
| 13.1 | 18.2 | 31.9 | 77.2 |
Table 3: Individual readings in samples of normal volunteers
| PT in seconds of | aPTT in seconds of | ||
|---|---|---|---|
| patients’ samples | patients’ samples | ||
| Before | After | Before | After |
| hemolysis | hemolysis | hemolysis | hemolysis |
| 17.6 | 16.6 | 35.1 | 25 |
| 19.1 | 13.7 | 35.4 | 25 |
| 30.5 | 17.8 | 33.3 | 31.8 |
| 26.1 | 18.9 | 80.1 | 33.4 |
| 16.6 | 15 | 53 | 27.2 |
| 21.6 | 15.3 | 27.1 | 28.4 |
| 16.2 | 15.1 | 66.8 | 25.4 |
| 76.9 | 35.1 | 56.2 | 33.7 |
| 17.9 | 14.4 | 28.1 | 24.2 |
| 24.4 | 23.2 | 31 | 34.1 |
| 21.1 | 20 | 31.3 | 28.9 |
| 14.6 | 12.9 | 28.6 | 28.4 |
| 16.9 | 16.3 | 31.5 | 31.7 |
| 24 | 22.1 | 35.1 | 36.6 |
| 17 | 14.9 | 33.9 | 33.3 |
| 17.7 | 16.3 | 32.9 | 33.6 |
| 46.7 | 34.9 | 49.3 | 49.2 |
Table 4: Individual readings in samples of patients
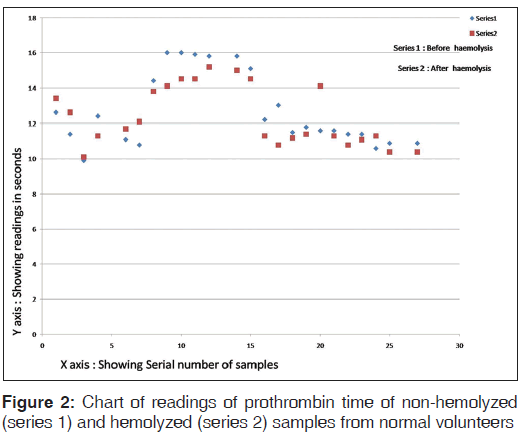
The chart of readings of PT of hemolyzed and non-hemolyzed samples from normal volunteers is shown in Figure 2.
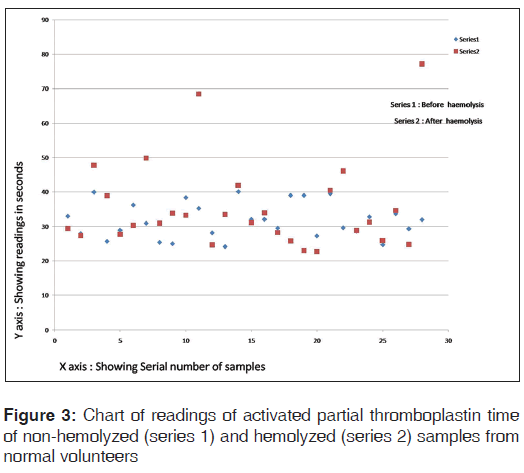
The chart of readings of aPTT of hemolyzed and non-hemolyzed samples from normal volunteers is shown in Figure 3.
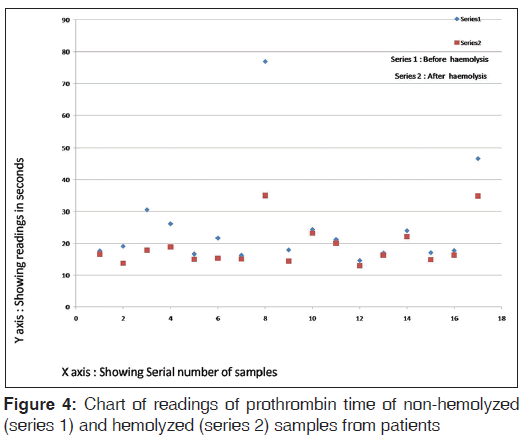
The chart of readings of PT of non-hemolyzed and hemolyzed samples from patients is shown in Figure 4.
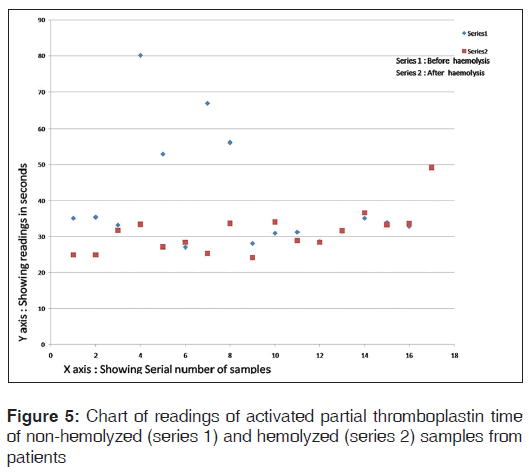
The chart of readings of aPTT of non-hemolyzed and hemolyzed samples from patients is shown in Figure 5.
Discussion
Hemolysis is a common finding in specimens sent to clinical laboratory for various tests, which includes coagulation testing also. The relative prevalence of hemolyzed specimens described in literature is as high as 3.3% of all of the samples afferent to a clinical laboratory.[9] Hemolysis is clearly visible in specimens containing as low as 0.5% hemolysate.[10] The presence or absence of hemolysis is judged by human eye and is rarely required to test it by measurement of supernatant hemoglobin. Hemolysis confers a detectable pink to red hue to serum or plasma.[10]
We wanted to study the changes in those hemolyzed samples, which can be detected by human eye. We have not measured the hemoglobin content of the supernatant plasma.
Hemolysis in general is caused by biochemical, immunologic, physical and chemical mechanisms. Blood cell lysis can arise in vivo from conditions such as hereditary, acquired and iatrogenic conditions, e.g., autoimmune hemolytic anemia, severe infections, disseminated intravascular coagulation or transfusion reactions. These conditions are not dependent upon technique of blood collection and/or transport and hemolysis in such samples is unavoidable.[11]
Conversely, in vitro blood cell lysis might be prevented, because it is usually caused by inappropriate specimen collection, handling and processing. In the case of specimen collection, hemolysis might result from traumatic specimen collection and processing, such as unsatisfactory phlebotomy attempts, difficulty in locating venous accesses, application of tourniquet for prolonged time, wet-alcohol transfer from the skin into the blood specimen, small or fragile veins, small-gauge needles, vigorous tube mixing and shaking or exposure to excessively hot or cold temperatures.[12]
Automated instruments use the various technologies for clot detection to measure PT and aPTT that includes optical, mechanical and electrochemical.[7] In optical method detection; the principles of detection include photo-optical absorbance, nephelometric turbidity detection, chromogenic and immunology based detection for determination of PT and aPTT. The nephelometer uses a light-emitting diode to detect variations in light scatter. When the light rays encounter insoluble complexes such as fibrin strands, they are scattered in both forward and side angles. Instruments employing this technique detect the amount by reading the increasing amount of light scattered at a 90° angle as agglutinates are formed. Thus, in these types of instruments there is a little influence of color development as is important factor in the instruments running on the principle of chromogenic assays. Hence, we speculated that the instruments running on the principle of nephelometer will not have effect of hemolysis as far as end point detection method is concerned.[13]
In our study, the PT and aPTT results of hemolyzed and non-hemolyzed pairs from normal individuals did not show statistically significant difference. It can be construed that the magnitude of difference will not be high so as to consider it clinically significant that would alter clinical decision. This finding raises the logic regarding specimen rejection and discard.
Previous studies indicate that there is shortening of aPTT in patient population, but lengthening of aPTT in normal population. It is postulated that there is release of substances, which activate the coagulation cascade thus causing shortening of PT.[13] In our study, we have found that there is prolongation of PT in hemolyzed specimen; similar with the previous study of Lippi et al.[14] The interference of hemolysis on coagulation studies is not necessarily only caused by hemoglobin, but many cell lysis substances are released in blood due to hemolysis and that could influence coagulation assays.[2] The exact mechanism for these changes occurring in the coagulation results is not clear.
Prolongation of the test result has been seen in some studies; this occurrence cannot be explained correctly, but one speculation is that exposure of membrane phospholipids could compete with thromboplastin for activated factor VIIa availability. However, there are no conclusive data to support or refute such statement.[2]
On the other hand, we observed statistically significant difference between PT and aPTT results between hemolyzed and non-hemolyzed pair from patients’ samples. This issue is difficult to resolve. This group of patients might be on heparin therapy, the samples might contain heparin and that platelet lysis in addition to red blood cell lysis could release platelet factor 4, which by partially neutralizing the heparin, would shorten the clotting time.
But, this was not seen in normal healthy donors. Healthy donors might be having lower baseline levels of Factor VIIa than hospitalized patients; hence, hemolysis induced activation of coagulation might not have been detected in normal donors.[2]
We induced the hemolysis in a mechanical manner in both the groups, which provides one experimental model for in vitro hemolysis in clinical specimen. Mechanically induced hemolysis is likely to be closer to venipuncture induced hemolysis, which is an important factor for hemolysis of the blood sample.
Conclusion
The samples sent for routine screening of coagulation testing, which are hemolyzed; should not be factor for rejection of these samples. Hence, we advocate running the tests on the samples even if they show some amount of hemolysis. We conclude that issuing results of coagulation tests of samples sent for routine screening, which are giving results in normal range, can be reported. But, if the sample is from patients who are receiving anticoagulation therapy; these samples can be reported with the caution that the sample was hemolyzed and needs to be repeated. This will result in decreasing the load on laboratories and hospitals, which are receiving high number of patients for routine coagulation screening.
Limitations of the study
This study has not taken into account the patient details about the dose and regime of anticoagulant therapy if any administered to the patients. The study has not analyzed relationship between degree of hemolysis and the changes in coagulation readings.
Acknowledgements
We would like to thank Dr. Satish Wadde, Associate Professor, MIMSR Medical College, Latur for his help in statistical analysis.
References
- Chawla R, Goswami B, Singh B, Chawla A, Gupta VK, Mallika V. Evaluating laboratory performance with quality indicators. Lab Med 2010;41:297-300.
- Laga AC, Cheves TA, Sweeney JD. The effect of specimen hemolysis on coagulation test results. Am J Clin Pathol 2006;126:748-55.
- Lippi G, Guidi GC. Effect of specimen collection on routine coagulation assays and D-dimer measurement. Clin Chem 2004;50:2150-2.
- Bauer NB, Eralp O, Moritz A. Effect of hemolysis on canine kaolin-activated thromboelastography values and ADVIA 2120 platelet activation indices. Vet Clin Pathol 2010;39:180-9.
- Marlar RA, Potts RM, Marlar AA. Effect on routine and special coagulation testing values of citrate anticoagulant adjustment in patients with high hematocrit values. Am J Clin Pathol 2006;126:400-5.
- van Geest-Daalderop JH, Mulder AB, Boonman-de Winter LJ, Hoekstra MM, van den Besselaar AM. Preanalytical variables and off-site blood collection: Influences on the results of the prothrombin time/international normalized ratio test and implications for monitoring of oral anticoagulant therapy. Clin Chem 2005;51:561-8.
- Arkin CF, Adcock DM, Ernst DJ, Marlar RA, Parish GT, Szamosi DI, Warunet DJ Collection, Transport, and Processing of Blood Specimens for Testing Plasma Based Coagulation Assays; Approved Guidelines. 4th ed. NCCLS document H21-A4 2003;23 (35).
- Plumhoff EA, Masoner D, Dale JD. Preanalytic laboratory errors: Identification and prevention. Available from: http://www.mayomedicallaboratories.com/articles/ communique/2008/12.html. [Updated on 2008 Dec; Cited on 2013 Jan 8].
- Carraro P, Servidio G, Plebani M. Hemolyzed specimens: A reason for rejection or a clinical challenge? Clin Chem 2000;46:306-7.
- Burns ER, Yoshikawa N. Hemolysis in serum samples drawn by emergency department personnel versus laboratory phlebotomists. Lab Med 2002;33:378-80.
- Rother RP, Bell L, Hillmen P, Gladwin MT. The clinical sequelae of intravascular hemolysis and extracellular plasma hemoglobin: A novel mechanism of human disease. JAMA 2005;293:1653-62.
- Kroll MH, Elin RJ. Interference with clinical laboratory analyses. Clin Chem 1994;40:1996-2005.
- Favaloro EJ, Funk DM, Lippi G. Pre-analytical variables in coagulation testing associated with diagnostic errors in hemostasis. Lab Med 2012;4:1-10.
- Lippi G, Montagnana M, Salvagno GL, Guidi GC. Interference of blood cell lysis on routine coagulation testing. Arch Pathol Lab Med 2006;130:181-4.


 The Annals of Medical and Health Sciences Research is a monthly multidisciplinary medical journal.