
Radiobiological Impact of Planning Techniques for Prostate Cancer in Terms of Tumor Control Probability and Normal Tissue Complication Probability
- *Corresponding Author:
- Suresh Rana
Department of Medical Physics, Pro Cure Proton Therapy Center, 5901 West Memorial Road, Oklahoma City 73142, USA.
E-mail: suresh.rana@gmail.com
Abstract
Background: The radiobiological models describe the effects of the radiation treatment on cancer and healthy cells, and the radiobiological effects are generally characterized by the tumor control probability (TCP) and normal tissue complication probability (NTCP). Aim: The purpose of this study was to assess the radiobiological impact of RapidArc planning techniques for prostate cancer in terms of TCP and normal NTCP. Subjects and Methods: A computed tomography data set of ten cases involving low‑risk prostate cancer was selected for this retrospective study. For each case, two RapidArc plans were created in Eclipse treatment planning system. The double arc (DA) plan was created using two full arcs and the single arc (SA) plan was created using one full arc. All treatment plans were calculated with anisotropic analytical algorithm. Radiobiological modeling response evaluation was performed by calculating Niemierko’s equivalent uniform dose (EUD)‑based Tumor TCP and NTCP values. Results: For prostate tumor, the average EUD in the SA plans was slightly higher than in the DA plans (78.10 Gy vs. 77.77 Gy; P = 0.01), but the average TCP was comparable (98.3% vs. 98.3%; P = 0.01). In comparison to the DA plans, the SA plans produced higher average EUD to bladder (40.71 Gy vs. 40.46 Gy; P = 0.03) and femoral heads (10.39 Gy vs. 9.40 Gy; P = 0.03), whereas both techniques produced NTCP well below 0.1% for bladder (P = 0.14) and femoral heads (P = 0.26). In contrast, the SA plans produced higher average NTCP compared to the DA plans (2.2% vs. 1.9%; P = 0.01). Furthermore, the EUD to rectum was slightly higher in the SA plans (62.88 Gy vs. 62.22 Gy; P = 0.01). Conclusion: The SA and DA techniques produced similar TCP for low‑risk prostate cancer. The NTCP for femoral heads and bladder was comparable in the SA and DA plans; however, the SA technique resulted in higher NTCP for rectum in comparison with the DA technique.
Keywords
Equivalent uniform dose, Normal tissue complication probability, Prostate cancer, RapidArc planning, Tumor control probability
Introduction
The primary objective of radiation therapy is to deliver enough radiation to the tumor to control it without irradiating normal tissues to a dose that will lead to serious complications. The clinical evidence shows that increasing tumor dose results in improved tumor control, especially for prostate cancer.[1,2] The developments in external beam radiation therapy (EBRT) such as intensity-modulated radiation therapy (IMRT) and volumetric modulated arc therapy (VMAT) allow the delivery of high dose to the target while minimizing the dose to the critical structures.[3-5] The IMRT is an advanced form of 3-dimensional conformal radiation therapy that combines intensity modulated radiation beams, whereas VMAT system is a rotational IMRT, which allows the simultaneous variation of gantry rotation speed, dose rate, and multi leaf collimator field aperture.[3] Recently, VMAT has gained widespread acceptance as the technique of choice for prostate cancer patients undergoing EBRT because VMAT can achieve IMRT quality dose distributions with reduction in the treatment delivery time and decrement in the number of monitor units.[3-5]
Several authors have carried out studies for prostate cancer comparing VMAT versus IMRT planning[6-12] as well as single arc (SA) versus double arc (DA)[10-12] within VMAT planning. Furthermore, the results in previous studies were evaluated mostly in terms of physical volume and physical dose,[6-12] and there are no radiobiological data available for VMAT planning techniques for prostate cancer. The radiobiological models describe the effects of the radiation treatment on cancer and healthy cells, and the radiobiological effects are generally characterized by the tumor control probability (TCP) and normal tissue complication probability (NTCP).[13,14] The objective of this study was to investigate the radiobiological impact of VMAT planning techniques in the form of RapidArc (Varian Medical Systems, Palo Alto, CA). Specifically, we performed the radiobiological comparison between SA and DA techniques in RapidArc planning on real computed tomography (CT) data sets of prostate cancer cases.
Subjects and Methods
CT simulation and contouring
Ten low-risk prostate cancer cases treated with RapidArc technique were included in this study. All patients were treated at West Hills Radiation Therapy Center, Vantage Oncology, California, USA, and this study was approved by the Research and Ethical Committee of the institution. Patients were immobilized in a Vac-Lok system (CIVCO Medical Solutions, Kalona, Iowa) and all patients were instructed to maintain a full bladder during CT simulation process. The CT scans were acquired with 512 × 512 pixels at 0.25 cm slice using General Electric light speed CT scanner (GE Health-care, Milwaukee, WI). The clinical target volume (CTV) comprised of prostate and proximal seminal vesicles as well as organs at risks (OARs) such as rectum, bladder, and femoral heads were delineated on the axial CT images in the Eclipse treatment planning system (TPS) (Varian Medical Systems, Palo Alto, CA). The planning target volume (PTV) was created from the CTV by a uniform expansion of 5 mm in all directions.
Planning, optimization, calculation
The planning parameters for treatment plans were set up using Varian standard scale in the Eclipse TPS (version 11.0.21) utilizing Varian Clinac i × 6 MV beams (Varian Medical Systems, Palo Alto, CA). Two sets of RapidArc plans were created in each case. The DA plan was created using two arcs; first arc in an anti-clockwise direction (arc angle: 1°→359°; collimator angle: 170°) and the second arc in a clockwise direction (arc angle: 359°→1°; collimator angle: 190°) [Figures 1 and 2]. The SA plan was created using a SA in an anti-clockwise direction (arc angle: 1°→359°; collimator angle: 170°). The field sizes of a SA in the SA plan were same as the field sizes of the first arc in the DA plan [Figures 1 and 2].

Figure 1: A transversal view of treatment plan set up using single arc (Arc angle: 1°→359°; collimator angle: 170°) technique in RapidArc planning for prostate cancer in Eclipse treatment planning system (Varian standard scale)

Figure 2: Schematic of double arc (left) and single arc (right) techniques for RapidArc planning in Eclipse treatment planning system (Varian standard scale)
All plans were inversely optimized using Varian Eclipse progressive resolution optimizer (version 11.0.21) with an objective of achieving at least 95% of the PTV receiving the prescription dose of 79.2 Gy in 44 fractions while keeping the dose to OARs below the planning limits [Table 1]. In order to make fair comparisons between the DA and SA plans, no modifications of dose-volume constraints and weightings were made during the optimization processes for both sets of plans. All optimized SA and DA plans were calculated with an anisotropic analytical algorithm (AAA), version 11.0.21, in the eclipse TPS, using 2.5 mm dose calculation grid.
| Normal organ limit* | D15% | D25% | D35% | D50% |
|---|---|---|---|---|
| Rectum | <75 Gy | <70 Gy | <65 Gy | <60 Gy |
| Bladder | <80 Gy | <75 Gy | <70 Gy | <65 Gy |
| Femoral heads | Mean dose <45 Gy | |||
*Normal organ limit refers to the volume of that organ that should not exceed the dose limit. Dx%: Dose received by x % of total OAR volume, where x % = 15, 25, 35 and 50, OAR: Organ at risk
Table 1: Dose specifications for rectum, bladder, and femoral heads
Radiobiological modeling
For radiobiological model response evaluation, cumulative dose-volume histograms (DVHs) of calculated treatment plans (SA and DA) were exported from the Eclipse TPS. The MATLAB and Simulink Student Version-R2012a (The MathWorks, Inc., Natick, Massachusetts) were used for radiobiological modeling analysis. We utilized the MatLab program[14] to calculate the Niemierko’s equivalent uniform dose (EUD)-based NTCP) and TCP values.
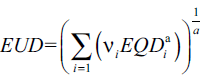
According to Niemierko’s phenomenological model, the EUD[14,15] is defined as:
 (1)
(1)
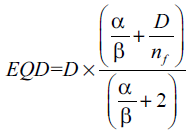
In equation (1), a is a unit less model parameter that is specific to the normal structure or tumor of interest, and vi is unit less and represents the ith partial volume receiving dose Di in Gy.[14] Since the relative volume of the whole structure of interest corresponds to 1, the sum of all partial volumes vi will equal 1.[14] Furthermore, in equation (1), the EQD[15] is the biologically equivalent physical dose of 2 Gy and defined as:
 (2)
(2)
where, nf and df = D/nf are the number of fractions and dose per fraction size of the treatment course, respectively. The α/β is the tissue-specific Linear Quadratic (LQ) parameter of the organ being exposed.[14,15].
TCP
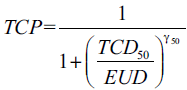
Niemierko’s EUD-based TCP[14,15] is defined as:
 (3)
(3)
where, TCD50 is the tumor dose to control 50% of the tumors when the tumor is homogeneously irradiated, and the γ50 is a unit less model parameter that is specific to the tumor of interest and describes the slope of the dose response curve.[14]
NTCP
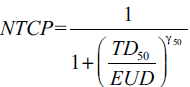
Niemierko’s EUD-based NTCP[14,15] is defined as:
 (4)
(4)
where, TD50 is the tolerance dose for a 50% complication rate at a specific time interval (e.g. 5 years in the Emami et al. normal tissue tolerance data[16]) when the whole organ of interest is homogeneously irradiated. The γ50 is a unit less model parameter that is specific to the normal structure of interest and describes the slope of the dose response curve.[14,15,17]
Evaluation and analysis
For the prostate tumor, the EUD and TCP values were calculated using the alpha-beta ratio of 1.2. Similarly, the EUD and NTCP values were calculated for the OARs. The alpha-beta ratio for rectum, bladder, and femoral heads used in this study were 3.9, 8.0, and 0.85, respectively. For a complete list of radiobiological parameters, please refer to Table 2. The statistical analysis was done using paired two-sided student’s t-test in a Microsoft Excel spreadsheet, and P < 0.05 (i.e., P < 0.05) was considered to be statistically significant.
| Tissue | Volume type | 100% dpf | #f | a | γ50 | TD50 (Gy) | TCD50 (Gy) | Dpf (Gy) | α/β (Gy) |
|---|---|---|---|---|---|---|---|---|---|
| Prostate | Tumor | 1.8 | 44 | −10 | 1.0 | - | 28.34 | 2 | 1.20 |
| Rectum | Normal | 1.8 | 44 | 8.33 | 4 | 80 | - | 2 | 3.90 |
| Bladder | Normal | 1.8 | 44 | 2 | 4 | 80 | - | 2 | 8.00 |
| Femur | Normal | 1.8 | 44 | 4 | 4 | 65 | - | 2 | 0.85 |
100% dpf: 100% dose per fraction, #f: Number of fractions, α/β: Alpha-beta ratio, dpf: Parameters’ source data’s dose per fraction, EUD: Equivalent uniform dose, TCP: Tumor control probability, NTCP: Normal tissue complication probability, Femur: Femur heads, TD: Tolerance dose, TCD: Tumor dose to control
Table 2: Parameters used to calculate Niemierko’s EUD-based TCP and NTCP
Results
The average volumes of the prostate tumor, rectum, bladder, and femoral heads were 125.3 ( 14.6) cc (range, 101.3-139.8 cc), 86.0 ( 31.4) cc (range, 49.6-159.1 cc), 171.9 ( 86.9) cc (range, 103.4-349.6 cc), 379.7 ( 71.2) cc (range, 257.6-515.8 cc), respectively. Table 3 shows the EUD and TCP values of prostate tumor for the SA and DA plans, whereas the EUD and NTCP values of rectum, bladder, and femoral heads are provided in Tables 4-6 respectively.
| Prostate | |||||
|---|---|---|---|---|---|
| Case no. | EUD (Gy) | ∆ (%) | TCP (%) | ||
| SA | DA | SA | DA | ||
| 1 | 78.45 | 78.22 | 0.30 | 98.33 | 98.31 |
| 2 | 78.07 | 77.71 | 0.47 | 98.29 | 98.26 |
| 3 | 78.55 | 78.10 | 0.58 | 98.33 | 98.30 |
| 4 | 78.56 | 78.18 | 0.48 | 98.33 | 98.30 |
| 5 | 77.31 | 77.20 | 0.14 | 98.23 | 98.22 |
| 6 | 78.74 | 78.41 | 0.43 | 98.35 | 98.32 |
| 7 | 78.15 | 77.58 | 0.73 | 98.30 | 98.25 |
| 8 | 78.32 | 77.61 | 0.91 | 98.31 | 98.25 |
| 9 | 78.11 | 77.95 | 0.20 | 98.30 | 98.28 |
| 10 | 76.76 | 76.72 | 0.05 | 98.18 | 98.17 |
| Average | 78.10 | 77.77 | 0.43 | 98.30 | 98.27 |
| SD | 0.62 | 0.52 | 0.27 | 0.05 | 0.05 |
| P value | 0.01 | 0.01 | |||
EUD: Equivalent uniform dose, TCP: Tumor control probability, SA: Single arc, DA: Double arc, SD: Standard deviation, Δ (%): ([SA-DA]/DA)×100
Table 3: EUD and TCP for prostate tumor in SA and DA plans
| Rectum | |||||
|---|---|---|---|---|---|
| Case no. | EUD (Gy) | ∆ (%) | NTCP (%) | ||
| SA | DA | SA | DA | ||
| 1 | 64.92 | 64.09 | 1.30 | 3.42 | 2.80 |
| 2 | 63.04 | 62.45 | 0.96 | 2.16 | 1.86 |
| 3 | 63.69 | 62.45 | 1.98 | 2.54 | 1.87 |
| 4 | 63.87 | 63.07 | 1.27 | 2.65 | 2.18 |
| 5 | 61.71 | 61.06 | 1.06 | 1.55 | 1.31 |
| 6 | 64.77 | 64.69 | 0.12 | 3.30 | 3.24 |
| 7 | 59.30 | 59.00 | 0.51 | 0.82 | 0.76 |
| 8 | 62.07 | 60.55 | 2.50 | 1.69 | 1.15 |
| 9 | 62.28 | 61.61 | 1.09 | 1.79 | 1.51 |
| 10 | 63.16 | 63.06 | 0.16 | 2.23 | 2.14 |
| Average | 62.88 | 62.20 | 1.09 | 2.21 | 1.88 |
| SD | 1.66 | 1.70 | 0.75 | 0.80 | 0.75 |
| P value | 0.01 | 0.01 | |||
EUD: Equivalent uniform dose, NTCP: Normal tissue complication probability, SA: Single arc, DA: Double arc, SD: Standard deviation, Δ (%): ([SA-DA]/DA)×100
Table 4: EUD and NTCP for rectum in SA and DA plans
| Bladder | |||||
|---|---|---|---|---|---|
| Case no. | EUD (Gy) | ∆ (%) | NTCP (%) | ||
| SA | DA | SA | DA | ||
| 1 | 37.65 | 37.46 | 0.52 | 0.00 | 0.00 |
| 2 | 43.54 | 43.34 | 0.44 | 0.01 | 0.01 |
| 3 | 49.76 | 48.89 | 1.77 | 0.05 | 0.04 |
| 4 | 34.42 | 34.12 | 0.87 | 0.00 | 0.00 |
| 5 | 44.32 | 44.44 | −0.28 | 0.01 | 0.01 |
| 6 | 39.16 | 39.25 | −0.22 | 0.00 | 0.00 |
| 7 | 50.21 | 49.61 | 1.21 | 0.06 | 0.05 |
| 8 | 45.27 | 44.81 | 1.01 | 0.01 | 0.01 |
| 9 | 28.54 | 28.35 | 0.66 | 0.00 | 0.00 |
| 10 | 34.27 | 34.29 | −0.05 | 0.00 | 0.00 |
| Average | 40.71 | 40.46 | 0.59 | 0.01 | 0.01 |
| SD | 13.21 | 20.75 | 0.64 | 0.46 | 9.24 |
| P value | 0.03 | 0.14 | |||
EUD: Equivalent uniform dose, NTCP: Normal tissue complication probability, SA: Single arc, DA: Double arc, SD: Standard deviation, Δ (%): ([SA-DA]/DA)×100
Table 5: EUD and NTCP for bladder in SA and DA plans
| Case no. | EUD (Gy) | ∆ (%) | NTCP (%) | ||
|---|---|---|---|---|---|
| SA | DA | SA | DA | ||
| 1 | 9.14 | 8.54 | 7.00 | 0.00 | 0.00 |
| 2 | 12.54 | 10.25 | 22.35 | 0.00 | 0.00 |
| 3 | 9.71 | 9.41 | 3.23 | 0.00 | 0.00 |
| 4 | 15.56 | 13.20 | 17.85 | 0.00 | 0.00 |
| 5 | 13.50 | 11.89 | 13.57 | 0.00 | 0.00 |
| 6 | 12.88 | 11.49 | 12.15 | 0.00 | 0.00 |
| 7 | 7.39 | 7.22 | 2.32 | 0.00 | 0.00 |
| 8 | 8.26 | 7.55 | 9.47 | 0.00 | 0.00 |
| 9 | 8.50 | 8.16 | 4.17 | 0.00 | 0.00 |
| 10 | 6.41 | 6.33 | 1.27 | 0.00 | 0.00 |
| Average | 10.39 | 9.40 | 9.34 | 0.00 | 0.00 |
| SD | 3.02 | 2.25 | 7.08 | 0.00 | 0.00 |
| P value | 0.01 | 0.26 | |||
EUD: Equivalent uniform dose, NTCP: Normal tissue complication probability, SA: Single arc, DA: Double arc, SD: Standard deviation, Δ (%): ([SA-DA]/DA)×100
Table 6: EUD and NTCP for femoral heads in SA and DA plans
Prostate tumor
For prostate tumor, the average EUD values in the SA plans (78.10 ( 0.62) Gy) were slightly higher than in the DA plans (77.77 ( 0.52) Gy) with an average difference of 0.4% showing the statistical significance (P = 0.01). The average TCP values of prostate tumor were comparable in the SA plans (98.30( 0.05%) and DA plans (98.27 (0.05%) with an average difference of 0.03%, but the results were statistically significant showing (P = 0.01).
Rectum
For rectum, the average EUD values in the SA plans (62.88 ( 1.66) Gy) were higher than in the DA plans (62.22 ( 1.71) Gy) with an average difference of 1.09% showing the statistical significance (P = 0.01). Similarly, the average NTCP values of rectum were higher in the SA plans (2.21 ( 0.80%) than in the DA plans (1.88 ( 0.75%), and the results were statistically significant showing (P = 0.01).
Bladder
For bladder, the average EUD values in the SA plans (40.71 13.21 Gy) were slightly higher than in the DA plans (40.46 20.75 Gy) with an average difference of 0.59% showing the statistical significance (P = 0.03). The average NTCP values of bladder were comparable in the SA plans (0.01) and DA plans (0.01), and the results were not statistically significant showing (P = 0.14).
Femoral heads
For femoral heads, the average EUD values in the SA plans (10.39 (3.02 Gy) were higher than in the DA plans (9.40 ( 2.25 Gy) with an average difference of 9.34% showing the statistical significance (P = 0.01). The average NTCP values of femoral heads were low for both SA and DA plans (<0.05%) and the results were not statistically significant showing (P = 0.26).
Discussion
In this radiobiological model response study, we compared the radiobiological impact of SA and DA techniques within RapidArc planning for low-risk prostate cancer. There were no clear differences in the TCP values between the SA and DA plans, and the EUD difference between the SA and DA plans for the prostate tumor was within 0.5%. For OARs, the SA technique produced higher EUD by about 0.59-9.34% in comparison to the DA technique. The NTCP values of femoral heads (0.00% vs. 0.00%) and bladder (0.01% vs. 0.01%) were comparable in the SA and DA plans, whereas the SA technique resulted in slightly higher average NTCP values for rectum (2.21% vs. 1.88%) in comparison with the DA technique.
Currently, the clinical radiobiological modeling data on VMAT planning of prostate cancer are lacking, and this may be due to current standard practice of evaluating treatment plans using physical dose-volume parameters. Number of previous studies investigated the dosimetric impact of SA and DA techniques in RapidArc planning of prostate cancer using DVH parameters. For example, Yoo et al.[10] reported that the DA technique produced lower doses to the rectum and bladder compared with the SA technique. In contrast, Sze et al.[11] showed that the DA technique produced higher dose to bladder at high dose levels when compared with the SA technique. Furthermore, Sze et al.[11] found that the DA technique produced lower rectal doses compared to the SA technique. In contrast, Guckenberger et al.[12] showed that the DA technique yielded higher dose to the rectum compared with the SA technique. It is clear that discrepancies exist among the results of previous studies[10-12] that evaluated dosimetric impact of SA and DA techniques in RapidArc planning of prostate cancer; however, the common finding was that the SA achieved better treatment efficiency with dosimetric results within planning criteria.
The results from this study showed that both SA and DA techniques are equally capable of producing similar radiobiological effect for tumor control while minimizing the normal tissue complications. The TCP and NTCP results of SA and DA techniques may become more clinically significant for high-risk prostate cancer that generally involves irradiation to larger pelvic area. In addition, we used the AAA as a choice of dose calculation algorithm in this study. Several authors have documented the inadequacy of AAA to calculate the dose accurately in inhomogeneous media.[18-21] It is essential to use the more accurate dose calculation algorithm for real patient treatment cases because the dose underestimation may increase the local disease recurrence, whereas the dose overestimation will likely increase the normal tissue toxicities. The impact of more accurate dose calculation algorithm such as Acuros XB[20,21] for prostate cancer cases, especially the ones involving metallic hip prostheses, on the TCP and NTCP will be an interesting topic for future studies.
Conclusion
In comparison to the DA technique, the SA technique produced similar TCP but higher EUD for low-risk prostate cancer. The NTCP values for femoral heads and bladder were comparable in both plans; however, the EUD to bladder and femoral heads were higher in the SA plans. The DA technique resulted in slightly lower EUD and NTCP values for rectum in comparison with the SA technique.
Source of Support
Nil.
Conflict of Interest
None declared.
References
- Pollack A, Zagars GK, Starkschall G, Antolak JA, Lee JJ, Huang E, et al. Prostate cancer radiation dose response: Results of the M. D. Anderson phase III randomized trial. Int J Radiat Oncol Biol Phys 2002;53:1097-105.
- Al-Mamgani A, van Putten WL, Heemsbergen WD, van Leenders GJ, Slot A, Dielwart MF, et al. Update of Dutch multicenter dose-escalation trial of radiotherapy for localized prostate cancer. Int J Radiat Oncol Biol Phys 2008;72:980-8.
- Otto K. Volumetric modulated arc therapy: IMRT in a single gantry arc. Med Phys 2008;35:310-7.
- Ling CC, Zhang P, Archambault Y, Bocanek J, Tang G, Losasso T. Commissioning and quality assurance of RapidArc radiotherapy delivery system. Int J Radiat Oncol Biol Phys 2008;72:575-81.
- Tang G, Earl MA, Luan S, Wang C, Mohiuddin MM, Yu CX. Comparing radiation treatments using intensity-modulated beams, multiple arcs, and single arcs. Int J Radiat Oncol Biol Phys 2010;76:1554-62.
- Kjaer-Kristoffersen F, Ohlhues L, Medin J, Korreman S. RapidArc volumetric modulated therapy planning for prostate cancer patients. Acta Oncol 2009;48:227-32.
- Zhang P, Happersett L, Hunt M, Jackson A, Zelefsky M, Mageras G. Volumetric modulated arc therapy: Planning and evaluation for prostate cancer cases. Int J Radiat Oncol Biol Phys 2010;76:1456-62.
- Palma D, Vollans E, James K, Nakano S, Moiseenko V, Shaffer R, et al. Volumetric modulated arc therapy for delivery of prostate radiotherapy: Comparison with intensity-modulated radiotherapy and three-dimensional conformal radiotherapy. Int J Radiat Oncol Biol Phys 2008;72:996-1001.
- Shaffer R, Morris WJ, Moiseenko V, Welsh M, Crumley C, Nakano S, et al. Volumetric modulated Arc therapy and conventional intensity-modulated radiotherapy for simultaneous maximal intraprostatic boost: A planning comparison study. Clin Oncol (R Coll Radiol) 2009;21:401-7.
- Yoo S, Wu QJ, Lee WR, Yin FF. Radiotherapy treatment plans with RapidArc for prostate cancer involving seminal vesicles and lymph nodes. Int J Radiat Oncol Biol Phys 2010;76:935-42.
- Sze HC, Lee MC, Hung WM, Yau TK, Lee AW. RapidArc radiotherapy planning for prostate cancer: Single-arc and double-arc techniques vs. intensity-modulated radiotherapy. Med Dosim 2012;37:87-91.
- Guckenberger M, Richter A, Krieger T, Wilbert J, Baier K, Flentje M. Is a single arc sufficient in volumetric-modulated arc therapy (VMAT) for complex-shaped target volumes? Radiother Oncol 2009;93:259-65.
- Zaider M, Minerbo GN. Tumour control probability: A formulation applicable to any temporal protocol of dose delivery. Phys Med Biol 2000;45:279-93.
- Gay HA, Niemierko A. A free program for calculating EUD-based NTCP and TCP in external beam radiotherapy. Phys Med 2007;23:115-25.
- Oinam AS, Singh L, Shukla A, Ghoshal S, Kapoor R, Sharma SC. Dose volume histogram analysis and comparison of different radiobiological models using in-house developed software. J Med Phys 2011;36:220-9.
- Emami B, Lyman J, Brown A, Coia L, Goitein M, Munzenrider JE, et al. Tolerance of normal tissue to therapeutic irradiation. Int J Radiat Oncol Biol Phys 1991;21:109-22.
- Okunieff P, Morgan D, Niemierko A, Suit HD. Radiation dose-response of human tumors. Int J Radiat Oncol Biol Phys 1995;32:1227-37.
- Robinson D. Inhomogeneity correction and the analytic anisotropic algorithm. J Appl Clin Med Phys 2008;9:2786.
- Rana S, Rogers K, Lee T, Reed D, Biggs C. Verification and dosimetric impact of Acuros XB algorithm for stereotactic body radiation therapy (SBRT) and RapidArc planning for non-small-cell lung cancer (NSCLC) patients. Int J Med Phys Clin Eng Radiat Oncol 2013; 2: 6-14.
- Bush K, Gagne IM, Zavgorodni S, Ansbacher W, Beckham W. Dosimetric validation of Acuros XB with Monte Carlo methods for photon dose calculations. Med Phys 2011;38:2208-21.
- Rana S, Rogers K. Dosimetric evaluation of Acuros XB dose calculation algorithm with measurements in predicting doses beyond different air gap thickness for smaller and larger field sizes. J Med Phys 2013;38:9-14.


 The Annals of Medical and Health Sciences Research is a monthly multidisciplinary medical journal.